
1 Introduction
Bathymetric survey is an activity to obtain the topography of the sea floor by coordinates and depths. During the last decade, a bathymetric survey changed the concept of technology in depth measurements. One of these developments is the concept of the bathymetric survey using multi beam echo sounder (MBES) which can measure the depth and provide almost total seabed coverage (IHO, 2005). A bathymetric survey using multi beam echo sounder (MBES) has an important role for mapping the sea floor topography, not only to produce high-quality navigation charts all over the world, but also to comply the survey in various discipline of hydrography (Ernstsen et al., 2006).
| Received, Revised, Accepted for publication |
|---|
In achieving the high-quality of depth data from MBES measurement, the error of depth should be considered carefully, especially in the critical areas that are less than 40 meter deeps or shallow water. Depth error refers to the reliability of depth data and is the difference between the true value of a measured quantity and the most probable value derived from a series of measurements. While true value may not be acquired, true error therefore may not be obtained as well. Hence, it is legitimate to define error sources, but the values obtained from an error budget are uncertainty estimates (IHO, 2008). Error sources are contributing components that can influence the depth data. The error budget is the error estimated ranges for contributing components of depth so that maximum allowable errors are specified to ensure that all errors sources are properly managed. Uncertainty is the interval that will contain the true value of the measurement at a specific confidence level.
Depth is divided into measured and reduced depth. Measured depth or also known as sounding depth that is obtained from MBES measurement, is determined by measuring two-way travel time and using knowledge about the sound velocity along the signal travel path. The distance called the slant range, measured between transducer and sea floor with a beam angle. Thus, the sounding depth could be determined by the slant-range multiplied by the cosine of the beam angle. The sounding depth also should be corrected by attitudes (pitch and roll) of vessel due to sea surfaces conditions. Whereas, reduced depth consists of heave and draught corrections, also water level reducers for referring to a datum. Accordingly, the depth error of MBES measurement is affected by following components: range, beam angle, sound velocity, pitch, roll, heave, draught, and water level (Hare et al., 2008). The error components of depth as presented by Hare (1995), can be developed for estimating of errors in pre-measurements and evaluating of errors in post-measurement so that the depth data can achieve a standard.
Depth quality standard of MBES is generally evaluated by International Hydrographic Organization (IHO) Special Publication No. 44, which specifies the minimum standards for the execution of hydrographic surveys (Haga et al., 2003). The primary aim of surveys is the collection of data which will be used to compile navigational charts for the safety of surface navigation and the protection of the marine environment. In IHO SP-44, depth error is represented by vertical uncertainty which is related to the 95% confidence level refers to the estimation of error. The capability of the depth measurement should be demonstrated by the total vertical uncertainty (TVU) calculation which contains depth independent and depth dependent errors that affect the uncertainty of the depths (IHO, 2008).
In order to ensure the depth error meets the TVU, an error model should properly be defined. Components that are contributing to depth error, namely range error, beam angle error, sound velocity error, pitch error, roll error, heave error, water level error, and draught error, can be transformed into depth error (Hare, 1995). Thus, the error budget of each component can be determined by adjusting the value of TVU.
2 Depth Measurement Using MBES and Standard of IHO Sp-44
The needs of bathymetric data are increasing due to its benefit for the variety of applications, such as marine navigation, offshore construction planning, port planning, etc. The one of techniques for bathymetric data procurement with large seafloor coverage is depth measurement using multi beam echo sounder (MBES). MBES uses the same principle as single beam echo sounder. A large array of transducers emits many beams of acoustic pulses simultaneously. The beams which are emitted by MBES are more than one beam and the beam pattern is emitted crosswise along the track (swath system), it will produce a single point of depth, then the points are connected to form seabed profiles. Hence, the MBES system may be possible to cover the sea floor up to 7 to 8 times the water depth below the transducer, but it depends on water depth, beam angle, and speed of the vessel (Dunnewold, J., 1998).
The concept of MBES only is the measurement activity using an acoustic signal that was determined by measuring two-way travel time and using knowledge about the sound velocity along the signal travel path. The distance called the slant range, measured between transducer and sea floor with a beam angle. Thus, the depth relative to the transducer could be determined by the slant-range multiplied by the cosine of the beam angle.
During the depth measurement process, numerous things can go wrong and generate errors in the resulting coordinates. The understanding of error sources for MBES measurement requires a good knowledge about the integration system which is used to obtain the depth information. The errors of integration system will contribute to the uncertainty in the resulting coordinates of soundings. Sounding uncertainty is a function of the errors in several parameters of MBES measurement.
The deep understanding of errors and uncertainty is essential for depth measurement using MBES. Thus, the measurement can produce the accurate coordinates, so that it can meet the common standards. The standard of accuracy for depth measurement, especially MBES, usually refers from IHO SP-44.
According to International Hydrographic Organization (2008), depth accuracy is referred to Total Vertical Uncertainty (TVU) which can be calculated by an equation as below:
\[\sigma = \pm \sqrt{a^2 + (b \times d)^2} \tag{1}\]
Depth is described with d, a refers to the portion of uncertainty not varying with the depth, b is a coefficient that represents the portion of the uncertainty varying with the depth. Equation 1 is used to compute the maximum allowable Total Vertical Uncertainty (TVU) at the 95% confidence level.
As presented above, the value of a andb for each survey order is determined based on Table 1.
| Order | Special | 1a | 1b | 2 |
|---|---|---|---|---|
| Parameters | a = 0,25 m | a = 0,5 m | a = 0,5 m | a = 1,0 m |
| b = 0,0075 | b = 0,013 | b = 0,013 | b = 0,023 |
Table 1. Standards of depth accuracy (IHO, 2008)
3 Depth Error Budgets in Geometry
Range and Beam Angle
The measured depth (d) can be determined from the range (r) (determined by measuring half the two-way travel time) with the beam angle (θ) in the body frame, as shown in Figure 1.
Figure 1 Range, beam angle, and measured depth (Hare, 1995)
Using simple geometry the depth below the transducer (d) can be calculated by:
\[d = r\cos\theta = -z \tag{2}\]
The range (r) and beam angle (θ) are the geometric distance and direction from the transducer to the point on the seafloor where the centre of the beam makes contact.
Sound Velocity
Measurements of sound velocity throughout the water column are required for corrections to each beam caused refraction effect. In addition, many beam forming systems require continuous and real time sound velocity measurements at the transducer in order to steer the beams. The sound velocity in the water column can vary spatially and temporally. Thus, sound velocity measurements should be performed periodically during the day, no less than twice per day, and at more frequent intervals or locations, to obtain the accurate depth measurements.
Errors in sound velocity measurement will affect to final depth data. There are several errors of sound velocity that must be known, such errors in sound velocity measurement due to sensor errors which are caused by bias in the water column (e.g., temperature, salinity, and depth dependent). Sound speed errors may also be due to changes in the water column with spatial and temporal changes in sound velocity profiles (Hare, 1995).
Vessel Attitude (Pitch, Roll, and Heave)
In obtaining the final depths, the observed depths must be corrected by vessel attitude (pitch, roll, and heave). The attitude of the vessel consists of three rotations about the conventional three orthogonal axes defined for the vessel. Hereafter the vessel co-ordinates system is defined as a right-hand system with the x axis pointing towards the bow, the y axis pointing towards starboard and the z axis pointing downwards. In this reference system roll corresponds to a rotation about the x axis (the roll is positive when the starboard side is down), pitch corresponds to a rotation about the y axis (the pitch is positive when the bow is up), and yaw corresponds to a rotation about the z axis (the yaw is positive for a clockwise rotation) (IHO, 2005). As shown in Figure 2.
The depth which is affected by roll and pitch can be calculated by substituting the values of Roll (R) and Pitch (P) from MRU into Equation 2, which is the principal equation for MBES depth calculation from the measured quantities of range, beam angle, roll and pitch (Hare, 1995).
\[d = r\cos P\cos(\theta + R) \tag{3}\]
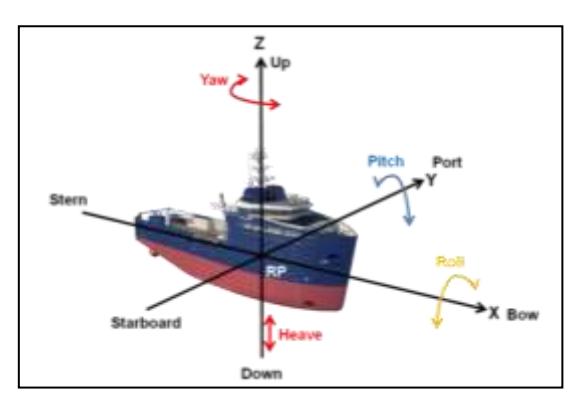
Figure 2 Attitude of survey vessel (IHO, 2005)
Heave is the relative vertical motion of the heave sensor with respect to its mean vertical coordinate over a predefined time period. In depth measurement, there are 2 (two) components of heave: measured heave (vertical motion of MRU from swell and waves) and induced heave (short period vertical motion of the transducer with respect to the MRU, caused by vessel angular motions).
Water Level
In determining the final depth, the water level data should be provided for the reduction of measured depth to the common datum. This process needs a sufficient observation to determine the variations of water level in the entire survey area (IHO, 2008). The water level reducers can be a significant corrector to depth measurement, relative to a datum (chart datum) particularly, in shallow water areas. The errors associated with water level reducers are generally not depth dependent, however. The main error sources of water level are caused by water level measurement at the gauge and spatially/temporally predicting at the location of depth measurement (Hare, 1995).
The error sources at the gauge can be defined based on the instrument types which are used to water level measurement. The several types of water level instrument that are commonly located in a coastal area, such as tide pole, floating gauge, pressure gauge, and acoustic gauge.
Vessel Draught
Vessel draught is defined as a distance between the transducer of MBES, attached to the vessel and the design water level (DWL), and this draught is called the static draught. DWL is a value in the design project of the vessel which can't be seen on board, expected that the water level (WL) is same with design water level (DWL), as shown in Figure 3.
For more accurate measurement, the vessel draught could be determined in real time, this is defined as dynamic draught (Aykut and Akpınar, 2013). The dynamic draught is made up of 3 (three) components, shown in the following equation (Hare, 1995):
Figure 3 The Static draught (Aykut and Akpınar, 2013)
wherestatic draught is the depth of the transducer below the water level when the vessel is at rest (static) at the start of the day, squat is the change in the draught with changes in vessel speed, and load is the change in draft over time because of fuel consumption, ballasting, etc.
4 Depth Error Equations
Measured Depth Error Equations
Think of Equation 3 as a mapping of the measured parameters into a measured depth. Applying propagation of errors to Equation 3 gives the following equation, which maps the measurement errors into a depth error.
\[\sigma_d^2 = \left(\frac{\partial d}{\partial r}\right)^2 \sigma_r^2 + \left(\frac{\partial d}{\partial \theta}\right)^2 \sigma_\theta^2 + \left(\frac{\partial d}{\partial P}\right)^2 \sigma_P^2 + \left(\frac{\partial d}{\partial R}\right)^2 \sigma_R^2 \tag{5}\]
The first term of Equation 5, after substituting partial derivatives of Equation 3 with respect to range, reduces to:
\[\sigma_{dr}^2 = (\cos P \cos(\theta + R))^2 \sigma_r^2 \tag{6}\]
Similarly, the depth variance due to beam angle errors is given by:
\[\sigma_{d\theta}^2 = (r\sin(\theta + R)\cos P)^2 \sigma_{\theta}^2 \tag{7}\]
The mapping for pitch errors into depth variance is given as follows:
\[\sigma_{dP}^2 = (r\cos(\theta + R)\sin P)^2 \sigma_P^2 \tag{8}\]
Finally, mapping for roll errors into depth variance is given by:
\[\sigma_{dR}^2 = (r\sin(\theta + R)\cos P)^2 \sigma_R^2 \tag{9}\]
The last error components of measured depth, sound velocity errors can be determined by derivative of two way travel time (TWTT) formula. Thus, the contribution for sound velocity errors into depth variance is estimated by:
\[\sigma_{dC}^2 = \left(\frac{d}{c}\right)^2 \sigma_C^2 \tag{10}\]
Reduced Depth Error Equations
The variance of measured heave comes from the manufacturer's specifications for heave accuracy. Determining for heave variance which can influence the final depth is given by:
\[\sigma_H^2 = \sigma_{Hmeas}^2 + \sigma_{Hind}^2 \tag{11}\] where the variance of roll and pitch induced heave can be calculated from the following equation:
\[\sigma_{Hind}^{2} = (x \cos P - y \sin R \sin P - z \cos R \sin P)^{2} \sigma_{P}^{2} + (y \cos R \cos P - z \sin R \cos P)^{2} \sigma_{R}^{2} + (\sin P)^{2} \sigma_{x}^{2} + (\sin R \cos P)^{2} \sigma_{y}^{2} + (1 - \cos R \cos P)^{2} \sigma_{z}^{2}\] (12)
The draught errors did not only consider from static draught measurement accuracy, but the squat condition of the vessel should be estimated, and the changes in draught due to changes in vessel loading must be updated too. The draught variance is calculated by the quadratic sum of the error sources as:
\[\sigma_D^2 = \sigma_{staticdraught}^2 + \sigma_{squat}^2 + \sigma_{load}^2 \tag{13}\]
The water level errors are made up by two main error sources which are due to water level measurement at the gauge and spatial/temporal prediction to the depth measurement position. The total water level error is calculated from the quadratic sum of the errors as:
\[\sigma_{WL}^2 = \sigma_{WLmeas}^2 + \sigma_{WLnred}^2 \tag{14}\]
Total Depth Error Budget
The total depth error budget for depth measurement using MBES is calculated from the root-sum-square (RSS) of combined of measured and reduced depth errors as follow:
\[\sigma_d = \sqrt{\sigma_{dr}^2 + \sigma_{d\theta}^2 + \sigma_{dP}^2 + \sigma_{dR}^2 + \sigma_{dC}^2 + \sigma_H^2 + \sigma_D^2 + \sigma_{WL}^2}\] (15)
In determining for depth quality, this total depth error can be evaluated by TVU of IHO SP-44 with 95% confidence level based on Equation 1, the equation as follows:
\[TVU \ge \sigma_d \times 1.96 \tag{16}\]
According to Equation 16, the result of total depth error should not exceed the value of TVU for meeting the specified standards. For this reason, the mapping of error components into total depth error must be determined carefully. The total depth error budget of components is set \(\pm\) 70% of TVU. The methodology for determining the total depth error and analysis of this research are summarized in the diagram, as shown in Figure 4.
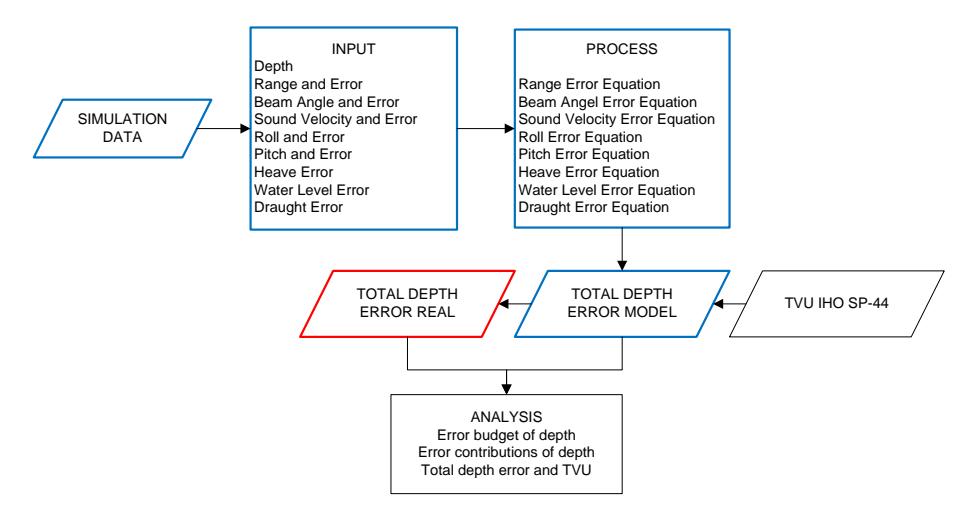
Figure 4 The flowchart of methodology
5 Total Depth Error Model and Experimental Test
The real measurement real data is bathymetric survey data using MBES which was conducted around Pondok Dayung Jetty, Tanjung Priok, DKI Jakarta on November 26th, 2016. See Figure 5 for location of data collection process (or of measurement and tide station). Data was collected using NorbitiWBMS Turnkey Multibeam Sonar System with the summary of specification as shown in Table 2. The acquisition and processing of MBES data used EIVA Marine Survey Software.
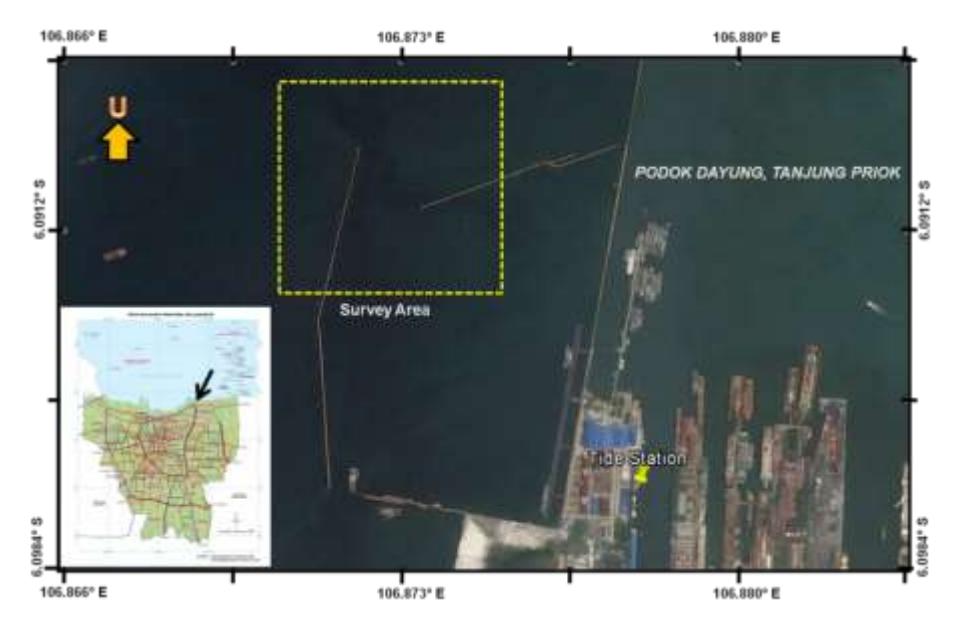
Figure 5 The location of measurement and tide station
Table 2. Technical Specification of NorbitiWBMS (www.norbit.com)
| Components | Accuracy (±) |
|---|---|
| Range | 0.01 m |
| Beam Angle | 0.05º |
| Roll | 0.02º |
| Pitch | 0.02º |
| Heave | 0.05 m |
For reduced depth data into a chart datum, water level data was obtained from PondokDayung Tide Station which was managed by Geospatial Information Agency (BIG). The location of tide station as shown in Figure 5.
The depth error of real data is a standard deviation of depth which is determined by repeated measurement at reference model. Furthermore, the depth error is evaluated with TVU of IHO SP-44 in 95% confidence level.
Total Depth Error Model
As shown in Table 2, data input for total depth error model are obtained from the manufacturer specification of instrument/components that are also used by real measurement and the simulation values for the model are determined using Table 3.The result of total depth error model is described in the chart, as shown in Figure 6.
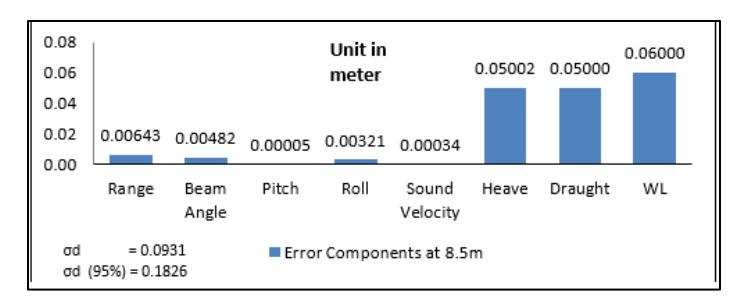
Figure 6 Diagram of total depth error model at 8.5 meter depth
| Components | Value | Accuracy (±) |
|---|---|---|
| Depth | 8.5 m | |
| Beam Angle | 45 | 0.05º |
| Sound Velocity | 1500 m/s | 0.06 m/s |
| Roll | 5º | 0.02º |
| Pitch | 1º | 0.02º |
| Water Level | 0.1 m | |
| Vessel Draught | 0.05 m |
Table 3. The simulation data
As presented in Figure 6, the maximum error comes from water level error and the minimum error is pitch error. Pitch error becomes a smallest due to the calculation of error using sin (trigonometry) so that it can be negligible for small pitch angles and ignored in the analysis (Hare, 1995). The water level can be a significant corrector to reduce the measured depth relative to chart datum. Hence, the water level error is a significant and dominant proportion of the total depth error budget in shallow water area with relatively high ranges of tide. The errors of water level are derived from 2 (two) main errors. In addition to the error in water level measurement at the gauge, a more significant error is the spatial/temporal correction (prediction) which is resulted from the difference of the actual water level in the survey area and in the gauge (IHO, 2005).
Model Testing (Real Measurement)
The result of total error and TVU analysis for real depth measurement are explained by Figure 7.
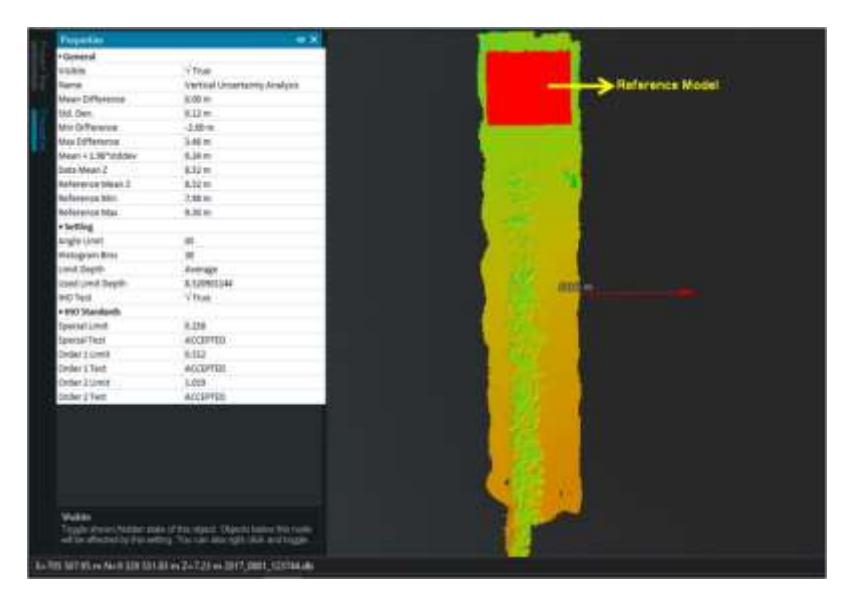
Figure 7 Total error and TVU analysis of real depth measurement using EIVA
The results of the analysis presented that both errors meet the IHO special order. According to the analysis, the model of total depth error budget can be used as an alternative for error contribution estimation of depth components and as an effective reference for selecting depth components (instrument) error to adjust with specified standards before measurement.
6 Conclusions
The total error budget for depth are made up by 8 (eight) following error components, which are range error, beam angle error, pitch error, roll error, sound velocity error, heave error, draught error, and water level error. The maximum error comes from water level error and the minimum error is pitch error. Pitch error can be negligible for small pitch angles and ignored in the analysis. Water level error is a significant proportion of the total depth error in shallow water area due to the error in water level measurement at the gauge and the spatial/temporal correction.
The results of total depth error model and total depth error real measurement achieve the same level of IHO standard. Thus, the model of total depth error can be used as an alternative for error estimation of depth components and as an effective reference for selecting depth measurement sensor accuracy to adjust with specified standards before measurement.
7 Acknowledgment
The authors wish to acknowledge the assistance of Master Study Program of Geodesy and Geomatics Engineering, Institute of Technology Bandung. The authors would also like to thank PT. GeotronixPratama Indonesia and BIG (Geospatial Information Agency) for providing the MBES measurement data and tide data.
8 References
- [1] Aykut, N.O. and Akpınar, B., 2013. Determining the dynamic draught for precise hydrographic surveying. Ocean Engineering, 62: 38–44.
- [2] Dunnewold, J., 1998. Dynamic Calibration of Multibeam Systems. Delft University Press.
- [3] Ernstsen, V.B., Noormets, R., Hebbeln, D., Bartholomä, A., and Flemming, B.W., 2006. Precision of high-resolution multibeam echo sounding coupled with high-accuracy positioning in a shallow water coastal environment. Geo-Marine Letters, 26: 141–149.
- [4] Haga, K.H., Pøhner, F., Nilsen, K., 2003.: Testing Multibeam Echo Sounders versus IHO S-44 Requirements. The International Hydrographic Review, 4.
- [5] Hare, R. 1995. Depth and Position Error Budgets for Mulitbeam Echosounding. The International Hydrographic Review, 72: .
- [6] Hare, R., Calder, B., Lee, A., 2008. Multi-beam Error Management-New data processing trends in hydrography. Hydro International.8: 6–9.
- [7] International Hydrographic Organization (IHO), 2005. Manual on Hydrography. Publication M-13, 1st edition, International Hydrographic Bureau, Monaco, .
- [8] International Hydrographic Organization (IHO), 2008. IHO Standards for Hydrographic Surveys. Special Publication No 44, 5th Edition, International Hydrographic Bureau, Monaco, .