
INTRODUCTION
Outer and Inner Ambon Bay which is separated by sill (depth 10m), have a unique oceanography dynamic. Ambon Bay is adjacent to Banda Sea. The bathymetry of the Ambon Bay shows clearly this separation (Figure 1). Banda Sea is affected by monsoonal wind in the seasonal scale (Boely et al. 1990; Zijlstra et al. 1990) and El Niño Southern Oscillation (ENSO) in the annual scale (Ilahude and Nontji, 1999). Ambon Bay is included the coastal area of Ambon city, i.e. the center of habitation, industry, and transportation, thus the development of Ambon city may give more stress to the Ambon Bay waters. Therefore, it is very important to analyze the oceanographic and climatic condition in the Ambon Bay.
Sea Surface Temperature (SST) and Sea Surface Salinity (SSS) are the most important oceanographic parameters. SST and SSS datasets can be used to analyze the oceanographic and climatic condition in the Ambon Bay. Based on the geographic condition, the water mass in Ambon Bay strongly affected by land and sea interaction surround Banda Sea water mass (Tarigan, 1989). The southeast monsoon which is characterized by the wind blow from the southeast to the northwest of the Indonesian archipelago, bring the Banda Sea water mass from the Outer Ambon Bay to the Inner Ambon Bay and cause the mixing between deep ocean water with the local water mass, with the percentage of local water mass is less than 30% (Riantika, 2011). During the northwest monsoon when the wind blows from the northwest to the southeast Indonesian archipelago reduce the effect of Banda Sea water mass to the Ambon Bay. This maximum effect is can be seen in the 60m depth.
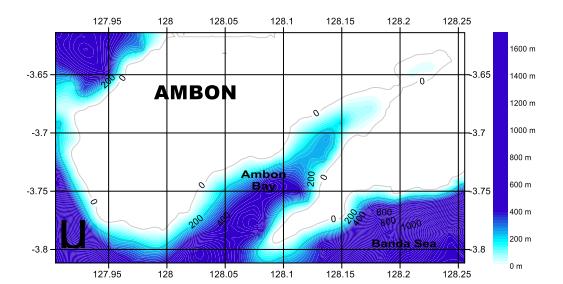
Figure1: Bathymetry of the Ambon Bay.
Besides ocean morphology, bathymetry, and Banda Sea water mass, heat and surface water mass balance also influence the SST variation in the Ambon Bay. Meteorology factor such as rainfall, evaporation, air temperature, wind speed, long of sun radiation, and SST itself are taking into account to determine this balance (Birowo, 1981; Nontji, 1987; Tarigan and Sapulete, 1987; and Wyrtki, 1957 and 1961 in Tarigan, 1989). SST in the Ambon Bay is maximum during Northwest monsoon, and it decrease during the first transition. The minimum SST is during the Southeast monsoon, and increase in the second transition.
SSS is the function of evaporation and precipitation (Hadi, 2010). The higher evaporation leads to higher SSS value. Conversely, the higher evaporation leads to the lower SSS. The rainfall variation in Ambon island is increase in April-May and maximum rainfall is occurred in June and July (Sumadhiharga et al. 1994, Aldrian and Susanto, 2003).
Banda Sea influenced by global climatic events such as El Niño Southern Oscillation (ENSO) and Indian Ocean Dipole (IOD). In the normal condition the trade winds bring the Pacific warm water pool westward. During El Niño condition, the trade winds are very weak and lead to the warm water pool concentrate in the center of Pacific Ocean and lower SST/ higher SSS in the west Pacific due to upwelling and lower precipitation than normal in this region. Inversely, during La Niña condition the trade winds are strongly push Pacific warm water pool westward and lead to the higher SST/ lower SSS in the west Pacific Ocean due to down welling and higher precipitation than normal. In this study, the oceanographic characteristic of the Ambon Bay is analyzed using the historical SST and SSS datasets. Further, this study will also be useful for the coral geochemical proxy calibration study in the Ambon Bay region.
MATERIAL AND METHODS
In this study SST datasets from Extended Reconstructed Sea Surface Temperature version 3b (ERSST v3b) is used. ERSST v3b is the latest version of ERSST model analysis data, which is reanalyzed from the International Comprehensive Ocean-Atmosphere Data Set (ICOADS) release 2.4 (Smith et al. 2008). There are improvements analyses using GTS ship and buoy data in the end of every month on the SST datasets (Xue et al. 2003). ERSST is in 2 ox2o grid resolution and in monthly resolution from 1854-present. SST used in this study taken from the grid of 4 oS and 128oE, which is supposed represent the SST of the Ambon Bay.
SSS data sets from Simple Ocean Data Assimilation 2.2.4 (SODA 2.2.4) is used. SODA model reanalysis combine the information of temperature, salinity, and seawater height using numeric method and winds observation as the forcing (Carton and Giese, 2005). SODA data is in 0.5ox0.5o grid resolution which is available from 1871-2008 periods. SSS used in this research taken from the grid coordinate of 3.75oS and 127.75oE which is supposed represent the SSS of the Ambon Bay.
In this study Oceanic Nino Index 3.4 (ONI 3.4) data from National Oceanic and Atmospheric Administration (NOAA) is used to identify the influenced of ENSO event to the SST and SSS. The periods and strength of El Niño, La Niña, and normal condition identified using ONI 3.4. ONI 3.4 is the anomaly of SST in the center of equatorial Pacific Ocean (5oN-5 oS and 120oW-170oW). Anomaly of SST>0.5oC refereed as El Niño, <-0.5oC refereed as La Niña, and between -0.5oC and 0.5oC are normal condition. ONI 3.4 is taken from National Weather Service, Climate Prediction Center, NOAA. Monthly ONI 3.4 data is the 3 month running anomaly of SST from ERSST v3b.
Dipole Mode Index (DMI) is the gradient of anomalous SST between the western equatorial Indian Ocean (50oE-70oE and 10oN-10oS) and the south eastern equatorial Indian Ocean (90oE-110oE and 0oN-10oS). Positive DMI refereed as the positive IOD, while negative DMI refereed as the negative IOD. SST DMI data set is weekly data which derived from NOAA Optimum Interpolation SST version 2 and taken from Japan Agency for Marine-Earth Science and Technology (JAMSTEC). The index is averaged to get monthly resolution.
Wind speed from NOAA - National Center for Environmental Prediction (NOAA – NCEP) Reanalysis I for surface level is used (Kalnay et al. 1996). NCEP Reanalysis I project is using forecast system to perform data assimilation using past data from 1948 till now. These data is in 2.5 ox2.5 o grid spatial resolution and in monthly resolution. Wind speed used in this research taken from the grid of 2.5oS and 127.5oE. Location of any datasets used in this study is show in Figure 2.
In this study we focus in monthly resolution data and for 2000 to 2008 periods. This period is selected since this study is a preliminary study of the coral proxy calibration in the Ambon Bay, which is the coral proxy available from 2000-2008 periods. To highlight the seasonal mean variability, the climatology/monthly mean data of historical oceanographic parameters are used. The anomaly data is obtained by subtracting monthly SST, SSS, and wind speed to its monthly mean. Oceanic Nino Index 3.4 (ONI 3.4) and Dipole Mode Index data used to identify the relationship between ENSO/IOD event to the variability of SST and SSS in the Ambon Bay. Statistical time series analysis is used to determine the correlation coefficient between SST/SSS and ENSO/IOD and monsoon.
Cross correlation is used to identify the time lag between the SST/SSS in the Ambon Bay respond to the ENSO/IOD event.
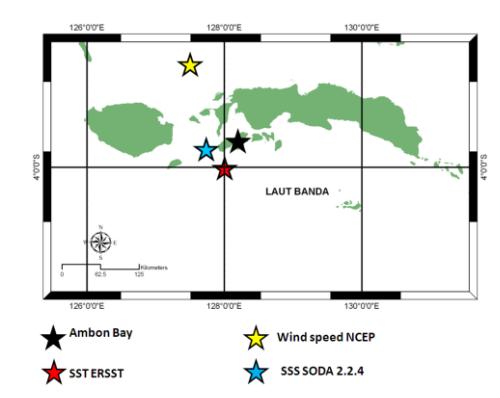
Figure 2: Location of gridded ERSST, SODA, and NCEP data used in this study.
RESULTS
The mean value of monthly SST ERSST data in the Ambon Bay for the period of 2000-2008 is \(28.85^{\circ}\)C (\(\sigma\)=0.84, n=108). For the period of 2000-2008 maximum SST 30.29°C is in November 2000 and minimum SST 27.07°C is in August 2007 (Figure 3a). There is very clear seasonal variation with two peaks of SST in each year (Figure 3b). In the seasonal SST variation maximum SST is in December (Northwest monsoon) and minimum is in August (Southeast monsoon). This confirms that August is the peak of Southeast monsoon in the Banda Sea (Gordon and Susanto, 2001) and Ambon Bay (Basit et al. 2008) which bring cool in this region.
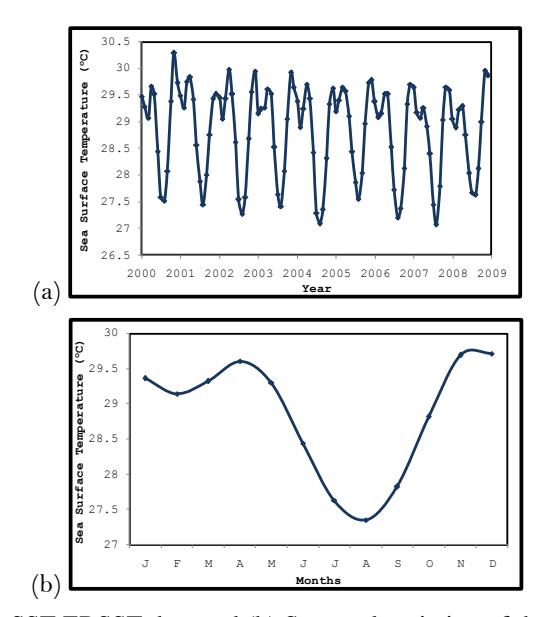
Figure 3: (a) Monthly SST ERSST data and (b) Seasonal variation of the SST in the Ambon Bay for 2000-2008 periods.
The mean value of monthly SSS SODA data in the Ambon Bay for 2000-2008 periods is 34.36psu (\(\sigma\)=0.29, n=108). Maximum SSS 34.96psu is in July 2008 and minimum SSS 33.50psu is in April 2004 (Figure 4a). SSS variations do not show very clear seasonal variation as it is shown by SST. Based on monthly mean SSS data, the maximum SSS is in July (Southeast monsoon) and the minimum SSS is in April (Figure 3b). The result is different with previous study which the maximum precipitation occurred in August thus lead to minimum SSS. It suggested that the difference of maximum/minimum of precipitation and SSS in seasonal scale is because of the SSS (SST) data however are not free of error, and those two data is obtained from the different datasets which could be result in the different uncertainty of the datasets. Both SSS and SST data resolution (i.e. grid resolution) however is not represent enough local variation of the Ambon Bay. To get more improve result of the oceanographic condition in Ambon Bay, however these historical SSS/SST dataset from the models (or reanalysis data) need to be calibrated with local measurement in this location, this will need a long time monitoring of oceanographic parameter.
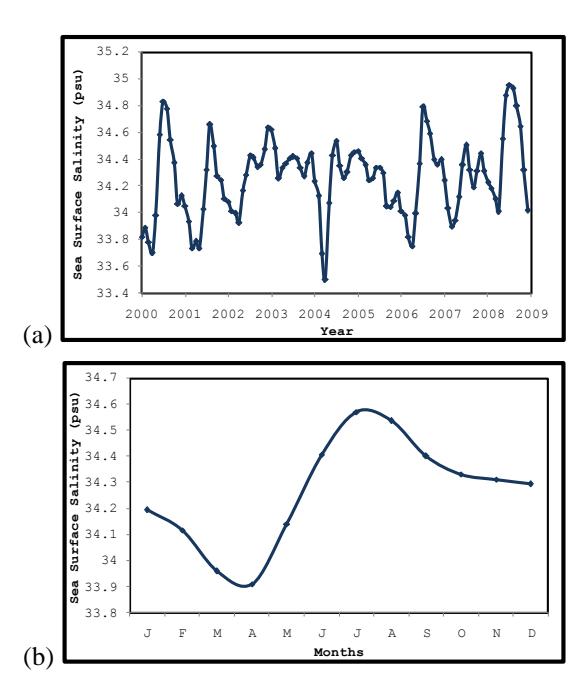
Figure 4: (a) Monthly SSS SODA data and (b) Seasonal variation of the SSS in the Ambon Bay for 2000-2008 periods.
Monthly SST and SSS are compared to wind speed. There is high correlation of both SST and SSS to the wind speed. Figure 5 shows the comparison of standardized wind speed, SST, and SSS. Correlation coefficient between SST and wind speed is r=-0.842 (n=108, p<0.05), while SSS and wind speed is r=0.493 (n=108, p<0.05). It convinces that SST and SSS variation are highly correlated with the monsoonal system.
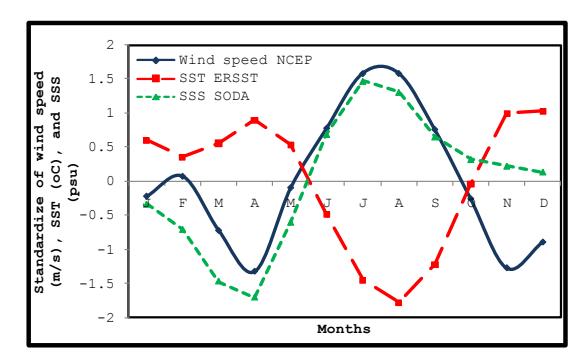
Figure 5: Comparison between the seasonal variation of wind speed, SST and SSS.
To get the anomaly of monthly SST and SSS data, the monthly variation of SST and SSS are subtracted to its monthly mean data. To understand the correlation of ENSO/IOD to the SST and SSS variation and to determine the dominant factor which affect to these parameters, the anomaly of SST and SSS is correlated with ONI 3.4, DMI, and anomaly of wind. Correlation coefficient between ONI 3.4 and SST anomaly is r=-0.071 (n=108, p>0.05) within 3 months lag time, and between DMI and SST anomaly is r=-0.365 (n=108, p<0.05). Correlation coefficient between ONI 3.4 and SSS anomaly is r=0.191 (n=108, p<0.05) within 3 month lag time, and between DMI and SSS anomaly is r=0.112 (n=108, p>0.05). It suggested that there is very small correlation between ENSO/IOD and SST/SSS anomaly in the Ambon Bay. The ENSO/IOD even do not strongly influent the SSS and SST variability in the Ambon Bay for the period of 2000-2008.
Discussion
Variability of SST in the Ambon Bay are mainly seasonal variation which is affected by monsoonal wind. There is high inverse correlation between SST and wind speed in the Ambon Bay. Wind speed affects SST by mixing process in the seawater surface. The higher the wind speed, the higher the mixing in the seawater surface and lead to the lower SST due to mixing of seawater surface and subsurface layer whose cooler temperature than the surface. Beside the influence of high mixing in the surface layer, the minimum SST in August are expected the effect of upwelling in the Banda Sea reaches into Ambon Bay. While SSS variability is not highly correlates with wind speed, because this probably that SSS is the function of evaporation and precipitation. However it can be expected that higher SSS in Southeast monsoon is the impact of upwelling in the Banda Seas which is bring the higher salinity form the deep ocean. For further analysis it is required to compare SSS and precipitation data.
Based on statistical analysis it is convinced that monthly SSS and SST anomaly is not correlated with ENSO/IOD for the period of 2000-2008. El Niño/negative IOD causes the lower SST and higher SSS than normal in Indonesia due to upwelling and low of precipitation. La Niña/ positive IOD cause the higher SST and lower SSS due to concentrated of warm water pool and high precipitation in the western Pacific Ocean. The local condition of Ambon Bay strongly influences the variability of SST and SSS in the Ambon Bay because of the morphology of Ambon Bay which shows semi-enclosed basin.
Conclusion
Seasonal variation of SST in Ambon Bay is influenced by wind speed. SSS do not show clear seasonal cycles during 2000-2008 periods. It is required further analysis of SSS variation using precipitation and evaporation data not just interpreted using wind speed data. ENSO/IOD having no impact on monthly SST and SSS variability and expected that local condition have greater impact into SST/SSS anomalies. The last but not least the local measurement data is required to improve the understanding of local oceanographic parameter at Ambon Bay, this need long time monitoring at the Ambon Bay.
Acknowledgements
Acknowledge to PT Freeport Indonesia undergraduate scholarship program. This work is also contributed to R.C. Geotechnology LIPI grant to SYC (PN9 program) and National Strategic Research 2013 "Implication of Climate Change and CO2 Cycles on Marine and Fisheries Sector: Policy Formulation Challenges for Mitigation and Adaptation in Indonesia" funded by the Directorate General of Higher Education, Ministry of Education and Culture of Republic of Indonesia.