
1. Introduction
A continuous time-series of hydrological data is required in river modelling (e.g. Sassi et al, 2010). However, due to some technical failure or natural obstacles, field measurement campaign conditions were not always ideal to obtain a undisrupted data. Data gap filling technique is then required to obtain a reliable reconstructed time-series during disruption of field measurements. Linear regression is an example of the simplest technique in data hole filling for parameters that can be linearized. Most of hydrological data, however, are highly non-linear. Therefore a more advanced techniques are required to complete some missing data in hydrological data time-series. A previous work reported by Acock and Papepsky (2000) used Group Method of Data Handling (GMDH) for filling gaps in weather data. However, the accuracy was rather low. The development in artificial intelligence has lead to application of data mining techniques in hydrology such as model tree and Artificial Neural Networks (ANNs). Dastorani et al. (2010) use ANNs and Adaptive Neuro Fuzzy Inference System (ANFIS) for filling flow data. Ustoorikar and Deo (2008) use genetic pogramming for filling up gaps in wave data. Solomatine and Dulal (2003) successfully apply model trees as an alternative to neural networks in rainfall-runoff modelling.
This paper is aimed to present and discuss the application of data mining technique in obtaining a continuous water level data in the tide-dominated Mahakam Delta region. In this study, we used the M5 model tree implemented in the Weka software packages (Witten & Frank, 2000). The main idea of the M5 model tree machine-learning technique is that the algorithm splits the parameter space into subspaces and then builds a linear regression model for each subspaces. Therefore, the resulting model can be regarded as a modular model, with the linear models for each particular subsets of the input space. The splitting in model tree follows the idea of a decision tree, but instead of the class labels it has linear regression functions at the leaves, which can predict continuous numerical attributes (Solomatine and Dulal, 2003). Therefore, they are analogous to piece-wise linear functions. Details of the M5 model tree training process are given by Witten & Frank (2000).
2. Methodology
Study area and Data collection
Figure 1 shows the study area in the lower Mahakam region, East Kalimantan, Indonesia. Water levels were measured using pressure sensors. Figure 2 shows water level records of the Mahakam Delta Apex station including the periods when disruptions occurred.
M5 model tree training
The M5 model tree used in this study is part of the Waikato Environment for Knowledge Analysis (WEKA) version 3.6.8, which was used to predict water level at the Delta Apex measurement station. The datasets obtained during the measurement campaign were split into the training and validation sets. The model was trained using the three-hourly water level data from the Delta Apex and Tenggarong measurement stations (Figure 3). Figure 3
(bottom panel) clearly shows the semi-diurnal character of tides in the region, and that the tides are still dominant in the upstream area at the Tenggarong station located about 40 km from the Delta Apex. Four previous time-step data from the Tenggarong station were included as input to the model to cover the time lag of tide propagation between the two stations. Therefore, in total, six attributes were included in the model training as listed below.
1. wlda: water level in the Delta Apex at time t
2. wltg-4: water level in Tenggarong at time t-4
3. wltg-3: water level in Tenggarong at time t-3
4. wltg-2: water level in Tenggarong at time t-2
5. wltg-1: water level in Tenggarong at time t-1
6. wltg : water level in Tenggarong at time
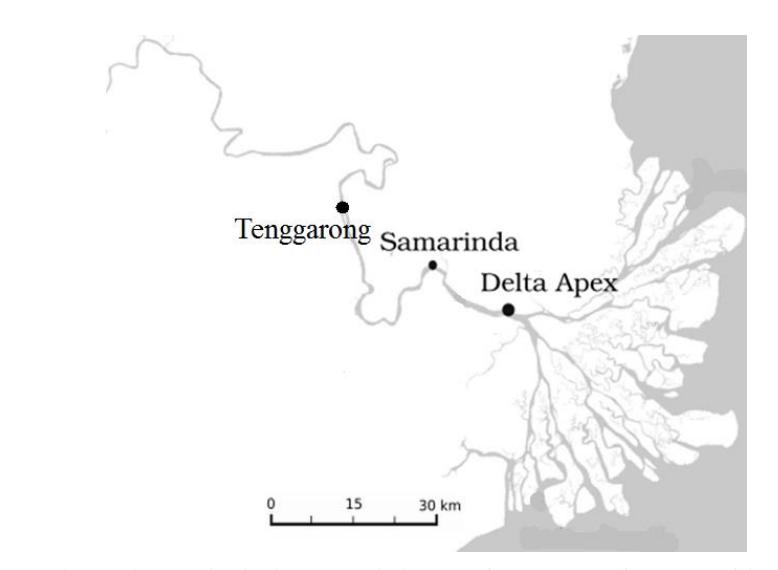
Figure 1. The study area in the lower Mahakam region, East Kalimantan with two water level measurement stations upstream and downstream the city of Samarinda.
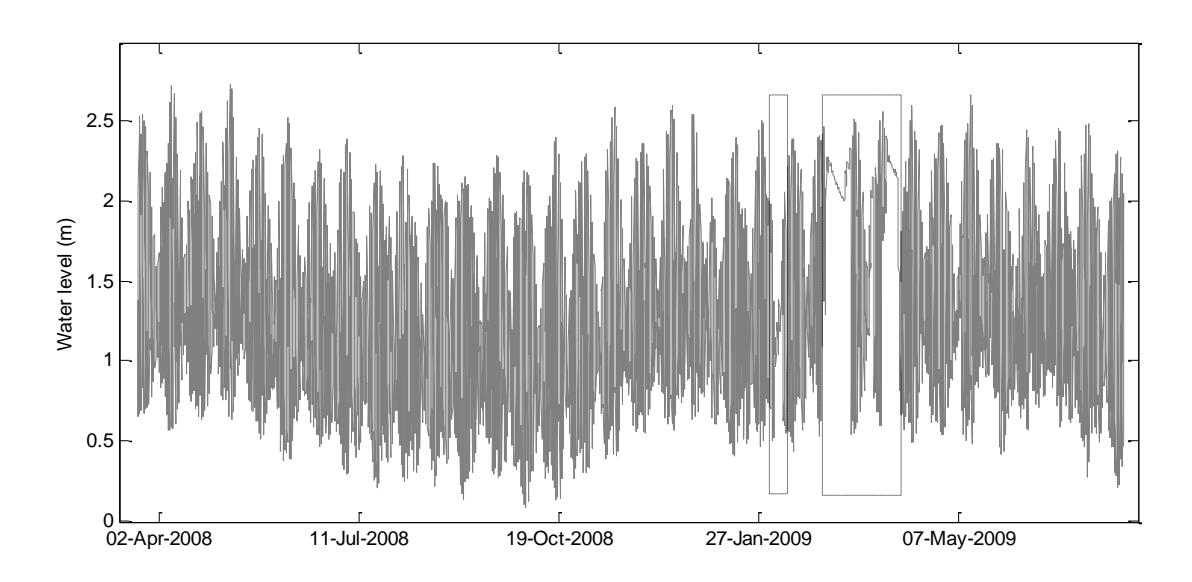
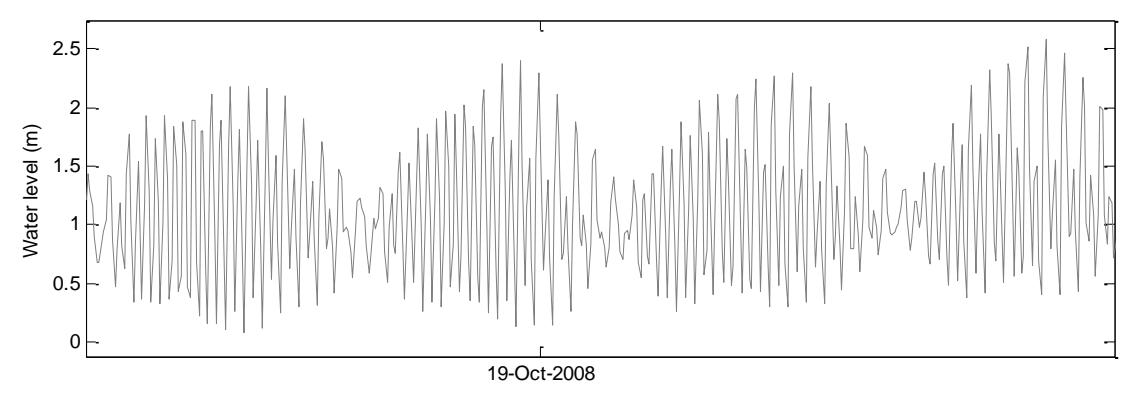
Figure 2. (top) Water level records of the Mahakam Delta Apex station. Dotted rectangles indicate periods when disruptions occurred. (bottom) The same data zoomed at four spring-neap cycles showing the semi-diurnal character of the tides in the region.
Figure 3. shows water level data from Delta Apex and Tenggarong measurement stations used for training the M5 model tree. The remainder of the data, which were not included in the model training process, were used for validation. Nash–Sutcliffe coefficient of Efficiency (E), which is commonly used in rainfall-runoff modelling was used to evaluate the discharge simulation by the model.
\[E = 1 - \frac{\sum_{t=1}^{T} (Q_o^t - Q_m^t)^2}{\sum_{t=1}^{T} (Q_o^t - \overline{Q}_o)^2}\] where Qo is observed discharge, and Qm is modelled discharge. Qo t is observed discharge at time t. In this study, discharges were replaced by water levels. E measures the ability to predict variables different from the mean and gives the proportion of the initial variance accounted for by the model. E can range from −∞ to 1.
3. Results
Nine model rules (using smoothed linear models) were obtained from the training of M5 model tree as shown below. The rules are executed sequentially until suitable conditions are matched with the last rule (Rule 9) being the last options to be evaluated. Validation using data that were not used in the training period shows that M5 model tree can satisfactorily be applied as an alternative tool for water level data gap filling in this tide dominated region with Nash-Sutcliffe model efficiency of 0.7.
Rule 1: IF wltg <= 1.12 AND wltg-2 > 1.277 AND wltg-3 <= 1.507
THEN wlda = -0.5489 * wltg-4 + 0.3123 * wltg-3 - 0.9132 * wltg-2 - 0.0525 * wltg-1 + 0.9957
* wltg + 1.3499
Rule 2: IF wltg <= 1.11 AND wltg > 0.654 AND wltg-1 > 0.913
THEN wlda = -0.4986 * wltg-4 + 0.3383 * wltg-3 - 0.4529 * wltg-2 - 0.3243 * wltg-1 + 1.2546
* wltg + 0.8106
Rule 3: IF wltg > 0.681 AND wltg <= 1.399 AND wltg-1 > 0.508 AND wltg-1 <= 1.225
THEN wlda = -0.6801 * wltg-4 + 0.938 * wltg-3 - 0.7321 * wltg-2 - 0.2264 * wltg-1 + 1.1896
* wltg + 0.7358
Rule 4: IF wltg <= 0.681 AND wltg-3 <= 0.88 AND wltg-1 > 0.503
THEN wlda = -0.437 * wltg-4 + 0.083 * wltg-3 - 0.1943 * wltg-2 - 0.6384 * wltg-1 + 1.56 *
wltg + 0.7738
Rule 5: IF wltg <= 1.399 AND wltg <= 0.657 AND wltg-1 > 0.416
THEN wlda = -0.5619 * wltg-4 + 0.5766 * wltg-3 - 0.0833 * wltg-2 - 1.4267 * wltg-1 + 1.7488
* wltg + 0.8051
Rule 6: IF wltg <= 1.399 AND wltg-1 <= 0.636
THEN wlda = -0.3536 * wltg-4 + 0.2982 * wltg-3 - 0.0857 * wltg-2 - 0.0565 * wltg-1 + 1.0266
* wltg + 0.7246
Rule 7: IF wltg > 1.399 AND wltg-1 <= 1.187
THEN wlda = -0.2353 * wltg-4 + 0.0644 * wltg-3 - 0.0814 * wltg-2 - 0.3179 * wltg-1 + 1.2267
* wltg + 0.6582
Rule 8: IF wltg <= 1.429
THEN wlda = -0.2144 * wltg-4 - 0.3331 * wltg-3 - 0.2493 * wltg-2 - 0.5784 * wltg-1 + 1.1145
* wltg + 1.3131
Rule 9: ELSE
wlda = -0.2716 * wltg-4 - 0.2042 * wltg-2 - 0.5887 * wltg-1 + 1.5593 * wltg + 0.5739
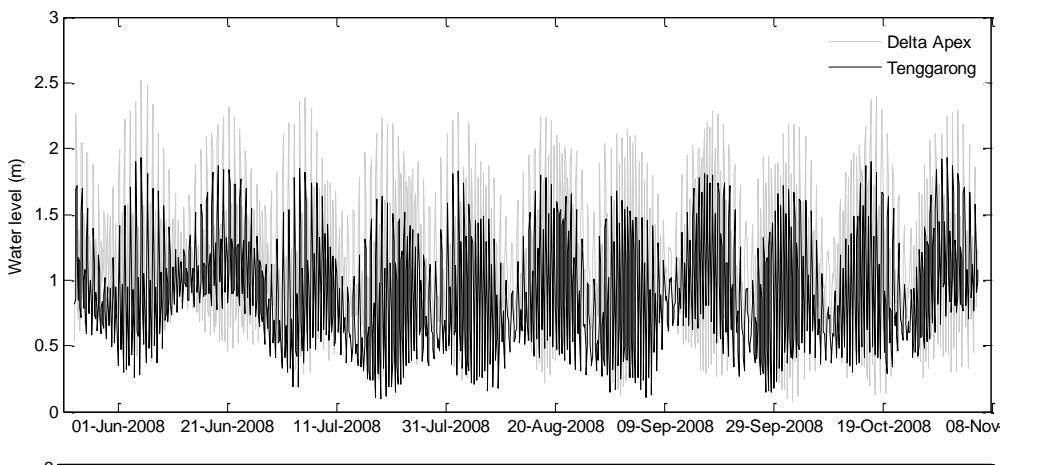
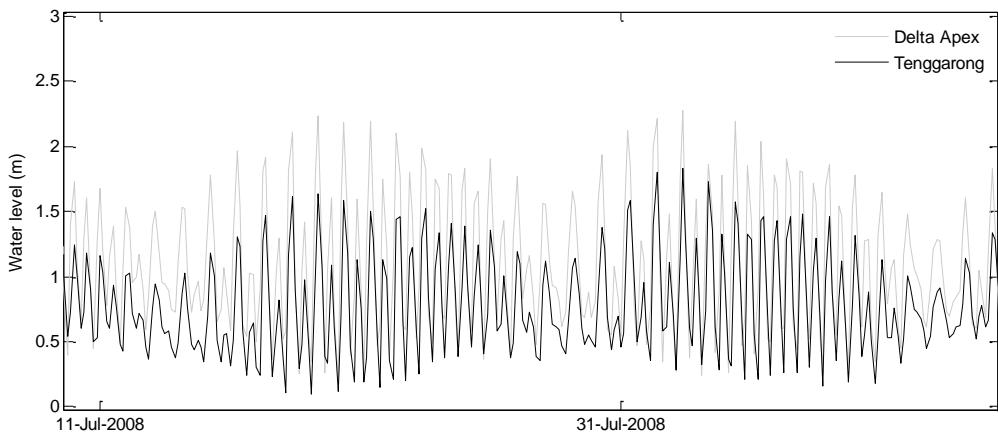
Figure 3. Water level data from Delta Apex and Tenggarong measurement stations used for training the M5 model tree (top panel). The lower panel is the same data zoomed into two springneap cycles.
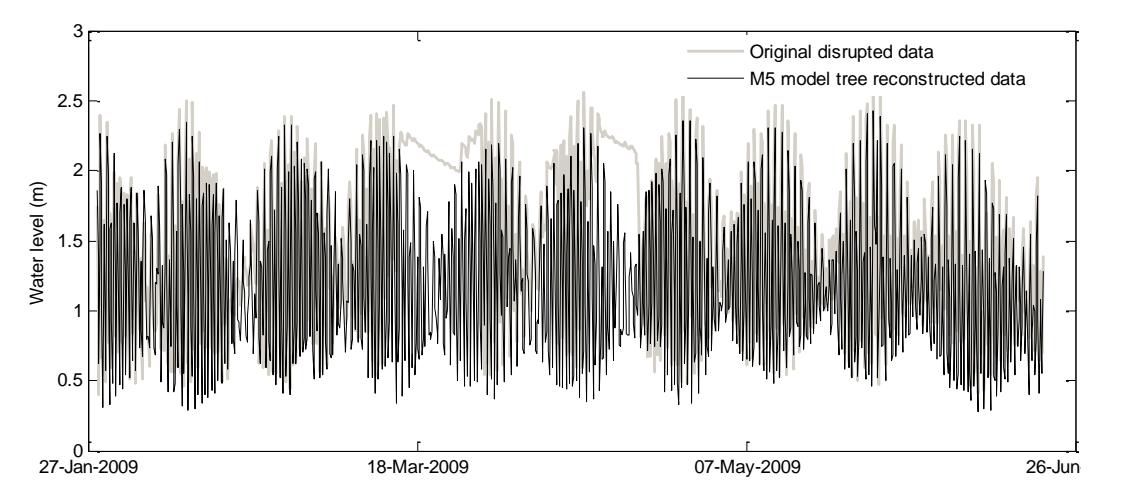
Figure 4. The reconstructed water level records at the Delta Apex station obtained using the M5 model tree.
4. Conclusion
Tidal signal in the Mahakam Delta that propagates far upstream is typically semidiurnal. The water level record at Tenggarong and Delta Apex stations showed similar properties with respect to tidal influence, except that the river flow influence is stronger in Tenggarong due to its more upstream location. Similarity in water level pattern can be used to model water level at a location using water level data at other location(s) using data mining technique. M5 model tree, was used to model water level at the Mahakam Delta Apex station using measured water level data at an upstream station in Tenggarong. Nine linear models were obtained from the training of M5 model tree using five components of input from Tenggarong station (water levels at time t, t-1, t-2, t-3, t-4). The model was applied to reconstruct the disrupted water level record during the period February to April 2009. Evaluation with data that are not used during the training period resulted in Nash-Sutcliffe model efficiency of 0.7 indicating a satisfactory agreement between the observed and modelled water levels.
5. ACKNOWLEDGMENTS
The authors would like to thank Maximiliano Sassi and Bart Vermeulen for their contribution in the collection of data used in this study.
6. REFERENCES
- Acock, M. C. and YA. A. Pachepsky (1999): Estimating Missing Weather Data for Agricultural Simulations Using Group Method of Data Handling, J. App. Meteorol., 39, 1176-1184.
- Dastorani, M.T., Moghadamnia, A., Piri, J., Ramirez, M.R. (2010): Application of ANN and ANFIS models for reconstructing missing flow data, Environ. Monit. Assess., 166, 421—343.
- Quinlan, J. R. (1992) Learning with continuous classes. In: Proc. AI'92 (Fifth Australian Joint Conf. on Artificial Intelligence) (ed. by A. Adams & L. Sterling), 343– 348. World Scientific, Singapore.
- Sassi, M. G., Schellen, S., Vermeulen, B., Hidayat, E., D., and Hoitink, A. J. F. (2010): Tidal impact on river discharge in the Mahakam River and distributary channels, East Kalimantan, Indonesia, in: Physics of Estuaries and Coastal Seas (PECS) conference, Colombo, Sri Lanka.
- Solomatine, D. P. and K. N. Dulal (2003): Model trees as an alternative to neural networks in rainfall—runoff modelling, Hydrol. Sci. J., 48:3, 399-411.
- Ustoorikar, K. Deo M.C. (2008): Filling up gaps in wave data with genetic programming, Marine Structures, 21: 2-3, 177—195.
- Witten, I. H. & Frank, E. (2000) Data Mining: Practical Machine Learning Tools and Techniques with Java Implementations. Morgan Kaufmann Publishers, San Francisco, USA.