
1. Introduction
Monitoring the coastal and marine waters is a subject of many countries' attention, including Indonesia which has more than 13.466 islands which encompass 75% (6.1 Million km2 ) of coastal and marine area. The country compose of a complicated geography with a great number of islands, narrow straits, large river estuaries, strong variations in bathymetry and mainly, a vast and large geographic area. For the Indonesian case, it is difficult to monitor the large coastal zone with only in situ observations. Facing to this problem, remote sensing methods give a practical solution as an effective tool for investigating and monitoring Indonesian waters. Remote sensing approaches applied to series of satellite images can provide information on a large area, showing the spatial and temporal development of sea surface features induced by various dynamic processes. Remote sensing reflectance is an important tools for characterizing the coastal and oceanic optical environment. The oceanic and coastal processes alter the optical properties of waters and these effects get manifested in the colour of the water. Remote sensing provides an extremely valuable tool for rapidly assessing the spatial variability of coastal and oceanic water reflectance patterns. Satellite based ocean colour sensors have been used to map biological and optical properties of the ocean on local and global scales.
The current operational algorithms for various ocean color satellites, including atmospheric corrections and bio-optical algorithms, produce large error in the tropical equatorial water. One of the problems in remote sensing of the tropical environment is the improvement of accuracy, related to water properties. As has been known, one of the keys to improve the accuracy of estimation of the seawater constituents from ocean color remote sensing is a better understanding of coastal bio-optical properties. In-water optical properties are classified into two main types: inherent optical properties (IOP) and apparent optical properties (AOP) (Preisendorfer, 1976). Until recently, most of the biooptical properties of the coastal and marine water have been acquired mainly at higher to midlatitudes coastal water. Only limited study of bio-optical model have been done in equatorial tropical country. The study of bio-optical properties in Indonesian water from MERIS data was done by Ambarwulan (2002, 2010), Ambarwulan at al. (2010, 2011, 2012).
The spectral diffuse attenuation coefficient Kd (λ) is one of the most important apparent optical property (AOP) of sea water (Preisendorfer, 1976). It is directly linked to the IOPs such as absorption and backscattering properties (Gordon, 1989; Lee et al., 2005). Kd is an indicator of water clarity and water quality and it is also indicator how strong light at a particular wavelength is attenuated within the water column. It plays a very critical role to understand the absorption and backscattering properties, photosynthesis and primary productivity models (Sathyendranath, 1989), biological processes in the water column, and to classify water types (Jerlov, 1976). Thus Kd is an important parameter for remote sensing of ocean color. Some research have been shown that Kd can be estimated reliably from remote sensing data in the Baltic Sea (Darecki & Stramski, 2004; Kratzer et al., 2008).
At present, three operational standard algorithms are used for deriving of Kd in ocean color remote sensing (Lee at al., 2005). Method 1, Direct One-Step Empirical Relationship for Kd(490) was developed by Austin and Petzold (1986). Kd is estimated from an empirical algorithm based on the relationship between Kd(490) and the blue-to-green ratio of water-leaving radiance, Lw, or remote sensing reflectance, Rrs (Mueller, 2000). Method 2, Two-Step Empirical Algorithm use Chl as an intermediate link. A commonly applied approach is first, deriving chlorophyll-a concentration, Chl, from remote sensing reflectance using the empirical algorithm (O'Reilly et al., 1998), and then derivingKd (λ) from Chl using another set of empirical relationships (Morel, 1988; Morel and Maritorena, 2001). Method 3 is a Semi-analytical Approach. The method involves the concept that the apparent optical properties (AOP) and the inherent optical properties (IOP) of seawater and boundary conditions (such as solar zenith angle and sea state) through radiative transfer theory.
The objective of this study was to retrive \(K_d\) from in situ and MERIS data using the semi-analytical approach.
2. Methodology
2.1 The Study Area Description
The Berau Estuary is located in Berau Regency, the East Kalimantan Province, Indonesia. Geographically, the Berau delta and its estuaries are located between 01°45′ to 02°35′ N and 117°20′ to 118°45′ E (Figure 1). The Berau Estuary is very unique environment with a range of shallow marine environments from turbid coastal estuarine to open oceanic and shelf edge reef conditions. The estuary is very rich marine biodiversity in Indonesia such as the mangrove system in the delta, the coral reef in the oceanic and seagrass around the Derawan Islands. The coral reef system in the Derawan Islands is famous as one of the best diving spot in Indonesia and is located around 40 km from the mouth of the Berau River. Monitoring the water quality of this complex estuary system is very challenging in the context of developing future plans to protect the coral reef life in this area against increasing sediment flux from the Berau River.
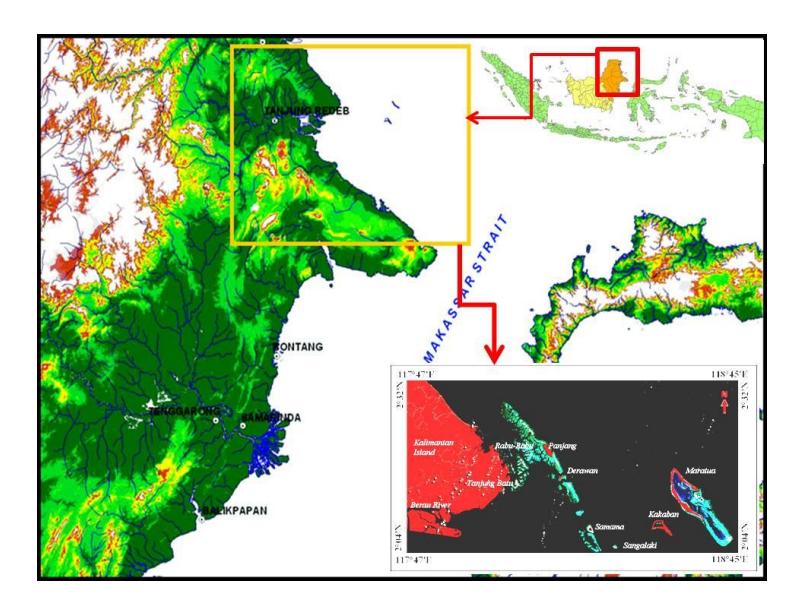
Figure 1. Study Area: The Berau Estuary, East Kalimantan, Indonesia
2.2. Data Set
a. Radiometric Measurement
The optical measurement was done in the Berau water in the periode of August - September 2007. An Ocean Optic spectrometer (USB4000) was used to collect in situ spectral measurements, following the REVAMP measurement protocols (Tilstone et al., 2004). The parameters of the optical measurement collected in this study area, the water leaving radiance, the downward skylight irradiance and subsurface upwelling irradiances were scanned at each station at different under water depths (10,30 and 50 cm). Totally 33 stations were measured in the Berau coastal water and nearby region. From those total field station observed, only 8 stations were match up with the MERIS data with low cloud present in the imagery.
b. Physical and biological variables
Bio-geophysical variables were measured in the field using digital water checker, Horiba U10, secchi disk depth and a Turner fluorescent spectrometer. The variables were measured in the same location as the optical data. The water samples were collected at depths between 20 and 50 cm, stored at a dark place at 5°C, and were analyzed immediately after arrival on the base camp on Derawan Island. The Total Suspended Matter (TSM) concentration was measured after filtering samples through a 47 mm diameter Whatman GF/F glass fiber filter with pore size of 0.45 μm, based on REVAMP protocols (Tilstone et al., 2004). The Chl a concentration was measured using a Turner fluorescence spectrometer. Other generic water quality variables (conductivity, temperature, pH, turbidity, dissolved oxygen and salinity) were measured using a Horiba U10 water quality multi-sensor probe. The Secchi disc depth and water depth was measured at each location using a Secchi disc (diameter 20 cm) and a GPS-coupled Garmin echo depth sounder, respectively.
c. Remotely sensed Imagery
Medium Resolution Imaging Spectrometer (MERIS), a remotely sensed imagery was used in this study. MERS Level 1b (L1b) and Level 2 (L2), provided by the European Space Agency (ESA) were used. In the period of 2003 until 2007, there are 20 MERIS L1b and L2 data sets at Reduced Resolution (RR) and Full Resolution (FR) available for this study area. However, not all the MERIS data were used in this study because of cloud present on this equatorial region, so the number of appropriate images become quite limited. From the available images, only three images were coincident with in situ measurements: August, 28 and 31, 2007 and September 15, 2007.
2.3 Methods and Algorithms
Three major processing steps have been carried out in order to estimate the \(K_d\) from MERIS data: (1) the estimation of \(R_{rs}\) from the in situ and MERIS data set, (2) the calculation \(K_d\) using the semi-analytical approach.
2.3.1. Estimation Remote Sensing Reflectance (Rrs)
The Rs of in situ optical measurement obtained with the Ocean Optic spectrometer which was the subsurface irradiance reflectance R (\(\lambda\), \(\theta\)) at each wavelength (\(\lambda\)) was calculated. The Subsurface irradiance reflectance, R (\(\theta\)-) is one of AOP parameters and is given by (Mobley, 1994) as the ratio of upward (\(E_u\)) and downward (\(E_d\)) irradiance (\(\mu\)Wcm<sup>-2</sup>nm<sup>-1</sup>) just beneath the water surface:
\[R(\lambda, 0^{-}) = \frac{E_{u}(\lambda, 0^{-})}{E_{d}(\lambda, 0^{-})}\](1)
The subsurface remote sensing reflectance was calculated using:
\[R_{rs}(0^{-}) = \frac{R(0^{-})}{Q} \tag{2}\]
Where Q stands for the geometric anisotropy factor of the underwater light field, usually taken as Q = 5 sr (Gege 2005). From the subsurface remote sensing reflectance, the above surface remote sensing reflectance was calculated using (see e.g. Bhatti et.al, 2009):
\[R_{rs}(0^+) = 0.544 * R_{rs}(0^-)\] (3)
The \(R_{rs}\) of MERIS data was derived with different atmospheric correction methods. Those algorithms are the ones that are plugged-in on BEAM Visat: the C2R algorithm and FUB. These deliver various output products. However, in this study focus will be on the remote sensing reflectance (product from C2R, FUB and MERIS L2.
2.3.2. Retrieval diffuse attenuation coefficients (Kd) using A Semi-analytical Approach
This study used the Method 3, the semi-analytical approach. The essence of this method is that \(K_d\) can be calculated based on the QAA and equation (4) when the values of \(R_{rs}\) (\(\lambda\)) are known. Lee et al (2005) described that the IOP parameters such as the values of the absorption, a, and backscattering, \(b_b\), coefficients are most essential to the determination of both apparent optical properties, \(R_{rs}\) and \(K_d\). When the values of a and \(b_b\) are known, along with boundary conditions, \(R_{rs}\) and \(K_d\) can be calculated using the semi-analytical models (Lee et al., 2004, 2005). In general the Method 3 is divided into 2 steps. The first step was calculated a and \(b_b\) parameters using a Quasi-Analytical Algorithm (QAA). The input of this step were \(R_{rs}\) of in situ measurement and \(R_{rs}\) of MERIS data. The second step was calculated Kd by using the formula established by Lee et al. (2005):
\[K_d = m_0 a + m_1 (1 - m_2 e^{-m3a}) b_b\] (4)
where \(m_0 \approx 1 + 0.005\theta_a\) and \(\theta_a\) is the solar zenith angle in air. The values for model constants \(m_1\), \(m_2\), and \(m_3\) are 4.18, 0.52, and 10.8, respectively (Lee et al., 2005). These values remain constant for different waters and different wavelengths.
3. Results and Discussions
3.1 Remote Sensing Reflectance
The magnitude and spectral variation of remote sensing reflectance (\(R_{rs}\)) depend on the IOPs i.e. absorption and backscattering properties of seawater itself, phytoplankton, Colour Dissolved Organic Matter (CDOM) and detritus. The \(R_{rs}\) of the Berau Estuary waters have been studied by Ambarwulan et al. (2010). There were 9 stations with remote sensing reflectance data measured by the Ocean Optic USB4000 which matched up with MERIS L1 of 31 August 2007. The spectra retrieved by applying the different algorithms on the MERIS L1 image data showed different shapes and magnitude of remote sensing reflectance, \(R_{rs}\). The Remote sensing reflectance of in situ measurement, \(R_{rs}\) of MERIS data using C2R, FUB and MERIS L2 algorithm are displayed on Figure 2.
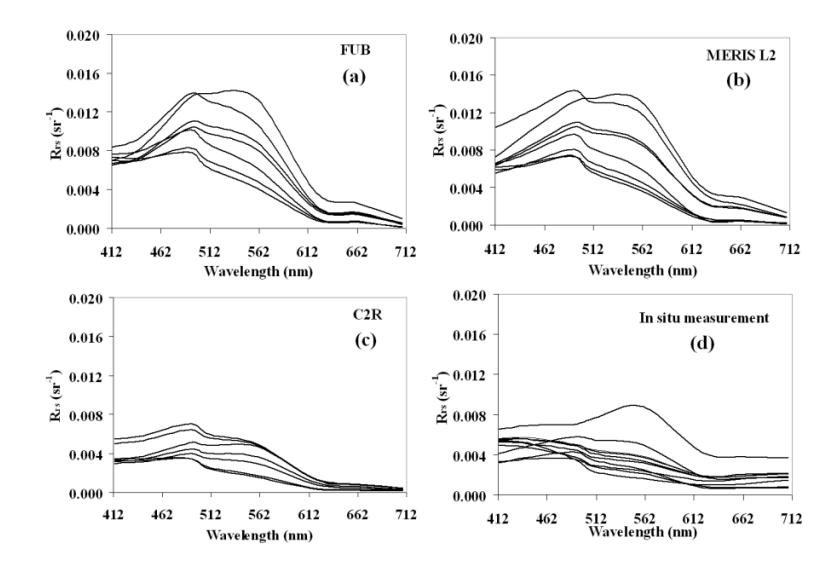
Figure 2. The Rrs of in situ measurement and Rrs of MERIS data derived from different algorithm (Ambarwulan et al., 2010)
3.2 Diffuse Attenuation Coefficient(Kd) Using Direct One-Step Empirical Approach
The diffuse attenuation coefficient (Kd) of the Berau Estuary waters was studied by Ambarwulan et al. (2010) from MERIS data and in situ measurements. The method for retrieving Kd was based on an empirical approach following the work of Kratzer (2008). The Kd measured and Rrs measured in the field on 31 August 2007 were used to establish the relationship between Kd and Rrs measured. The best fit between Rrs measured and Kd measured was achieved with the ratio Rrs at 490 and 620 nm (R2= 0.76) for the Berau Estuary waters is:
\[\ln(Kd(490)-K_{dw})=0.49*\ln(R_{rs}490/R_{rs}620)+0.028.\]
The research found that the best Kd(490) model have a similar pattern which was high in the location close to the Berau river mouth and decreases towards the open sea. The best model between Kd(490) and distance was exponential, with R2 were 0.61; 0.67 and 0.77 for C2R, MERIS L2 and FUB respectively.
3.3 Diffuse Attenuation Coefficient Using the Semi-analytical Approach
For this study, the Rrs of in situ measurements have been calculated using Eq. (1) to Eq. (3). Whereas, the Rrs from MERIS data were derived by applying global algorithm of MERIS L2, C2R and FUB algorithms using the BEAM software. The MERIS L2 and C2R water leaving radiance reflectance (Rw) were converted to Rrs. The best correlation between Rrs in situ measurement and Rrs MERIS data was analyzed based on the degree of coefficient of determination (R 2 ) were 0.72, 0.63 and 0.59 for C2R, FUB and MERIS L2 respectively.
The Rrs of in situ measurement of the Berau Estuary waters was an input on the QAA as well as Rrs of MERIS data derived with different algorithms. The absorption, a, and backscattering, bb, coefficient derived from QAA were used as the input of the Kd algorithms. The diffuse attenuation coefficient of in situ measurements and MERIS data at wavelength 490 nm (Kd(490)) in the Berau Estuary waters was derived by using Eq. (4). The Kd(490) derived from in situ measurement as well as MERIS data displayed in Table 1 and Figure (3a).
Table 1. The magnitude of Kd(490) derived by the semi-analytical approach from in situ measurement and MERIS data
| INSITU | FUB | C2R | L2 | |
|---|---|---|---|---|
| Minimum | 0,080 | 0,077 | 0,071 | 0,107 |
| Maximum | 0,328 | 0,218 | 0,265 | 0,459 |
| Mean | 0,139 | 0,121 | 0,133 | 0,219 |
Table 1 showed that the magnitude of the Kd(490) in this study was the highest in one derived from \(R_{rs}\) reflectance of MERIS data using MERIS L2 global algorithm and the lowest one was derived from \(R_{rs}\) of MERIS data using FUB algorithm. The Figure (3a) showed that Kd(490) of in situ measurement and Kd(490) derived from MERIS data using C2R, FUB and MERIS L2 have the similar trend which is low in the clear water stations (31-2, 31-3, 31-8 and 31-9), and higher in the more turbid water station (31-6). This was due to the fact that the station 31-6 was located on the turbid water and decrease the turbidity on the station 31-5, 31-3, and 31-7. Hence, the station 31-2, 31-3, 31,8 and 31-9 were located in the clear waters. The result shows that the higher Kd(490) were found around the river mouth of the Berau River and decrease to the open sea.
The best fit between Kd(490) measured in situ and Kd(490) derived from MERIS data was obtained based on the highest \(R^2\) and the lowest RMSE. The study found that the best fit correlation between Kd(490) measured in situ and Kd(490) derived from MERIS data with \(R_{rs}\) of FUB algorithm (\(R^2\)=0,84) and followed by \(R_{rs}\) of MERIS L2 (\(R^2\)=0,81) and \(R_{rs}\) of C2R (\(R^2\)=0,76). In order to evaluate the performance of the Kd(490) retrieval using the semi-analytical approach, the Root Mean Square Error (RMSE) was calculated. The RMSE Kd(490) of FUB is lower than C2R and MERIS L2 especially in the clear water. However in the turbid water the RMSE of C2R was lower compare to FUB and MERIS L2. In this case, we may conclude that the atmospheric correction is responsible for the different results.
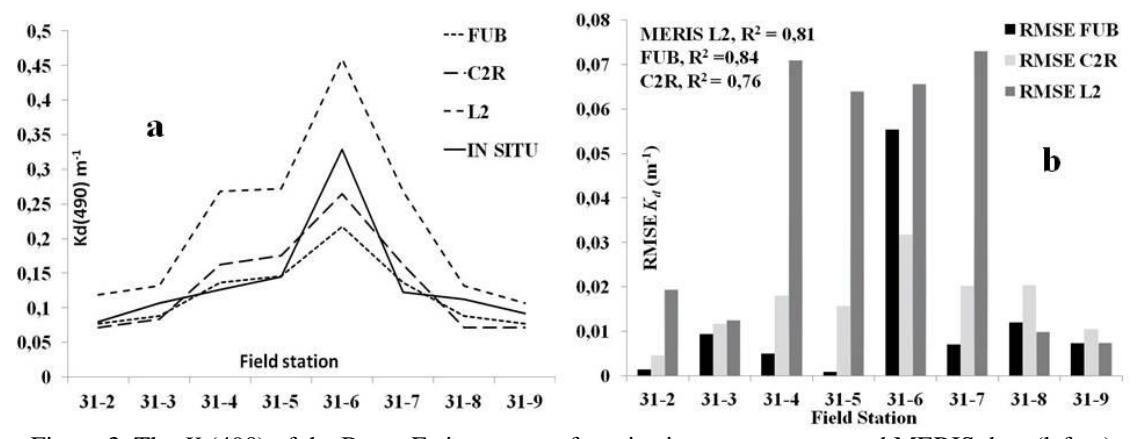
Figure 3. The \(K_d\)(490) of the Berau Estiary waters from in situ measurement and MERIS data (left, a) and the RMSE and R2 of \(K_d\)(490) (right, b)
3.4 Spatial Temporal Dynamic of Diffuse Attenuation Coefficient
In order to understand the spatial and temporal dynamics of \(K_d(490)\) in the Berau Estuary, the \(K_d(490)\) was estimated from MERIS data recorded, such as 28 August 2007, 31 August 2007 and 15 September 2007. Figures 4a, 4b and 4c illustrate the estimated \(K_d(490)\) for the Berau Estuary waters from reduced resolution MERIS data. The 1200 m resolution of MERIS data reveals the spatial distribution of \(K_d(490)\) throughout the study area. These \(K_d(490)\) gradients are particularly evident in the middle portion of the image where the Berau River flows into the estuary. It shows clearly that \(K_d(490)\) is higher around the coastal area and decrease when going to the sea.
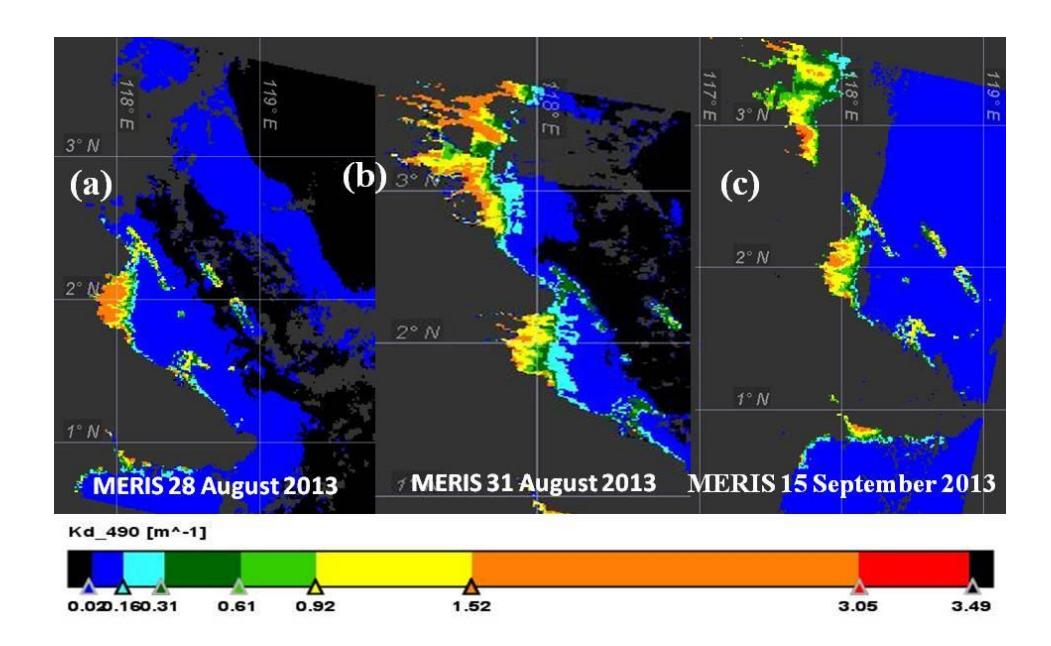
Figure 4. The Kd(490) from MERIS data at 28 and 31 August 2007and 15 September 2007
The spatio and temporal dynamic were also discussed by using three samples or pin points representing different water turbidity levels which were selected. These pin points spread out from shallow and turbid water close to the Berau river mouth into the inner shelve and lastly in the outer shelve. The analysis of Kd(490) at the 3 pin points is displayed in Figure 5.Similar patterns of Kd(490) occurred for turbid, medium turbid and clear water with Secchi disk depths of 0,8 meter, 4 meter and 10 meter respectively. In general the Kd(490)dereived using C2R was robust for the medium to clear water, however over estimation on the turbid water. This case can be explained due to the IOP used in the C2R was the IOP of the high latitude water such as European coastal waters.
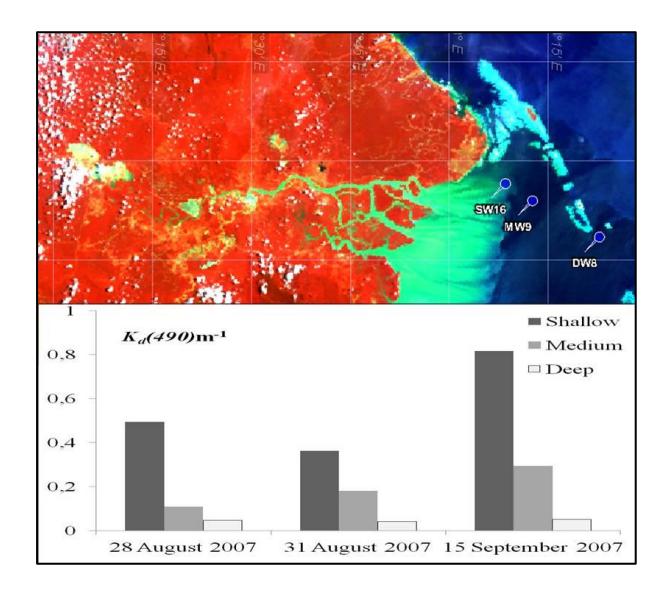
Figure 5. The spatio and temporal dynamic of Kd(490) in the Berau Estuary waters
4. Conclusions
From the results obtained, it can be concluded that in this equatorial coastal zone, the MERIS RR data permit to derive optical water properties such as diffuse attenuation coefficient (Kd(490)) with a reasonable accuracy. The semi-analytical approach that involves the concept that the apparent optical
properties (AOP) and the inherent optical properties (IOP) of seawater give a better result on estimating \(K_d(490)\) from MERIS data. The \(K_d(490)\) with remote sensing reflectance derived with FUB, C2R and MERIS L2 give a good correlation with \(K_d(490)\) derived with Rrs of in situ measurement and its proved with the quite highr \(R^2\) and less RMSE. The \(K_d(490)\) derived with FUB was the low RMSE and high \(R^2\).
5. Acknowledgements
The financial support for this research was provided under the East Kalimantan Project financed by the Foundation for the Advancement of Tropical Research (WOTRO) – Royal Netherlands Academy of Arts and Sciences (KNAW). The authors would like to thank the European Space Agency for providing the MERIS data. Acknowledgement also to Prof. Dr Ing Wouter Verhoef, Dr.C.M. Mannaerts, Dr. M.S. Salama and Dr. H.J. van der Woerd for the invaluable advice and assistance.
6. References
- Ambarwulan, W., W.Verhoef, C.M. Mannaerts, M.S. Salama. 2012. Estimating Total Suspended Matter concentration in tropical coastal waters of the Berau Estuary, Indonesia. International Journal of Remote Sensing, Volume 33, Issue 16, 2012.
- Ambarwulan, W., M.S. Salama, C.M. Mannaerts, W. Verhoef. 2011. Estimating the Specific Inherent Optical Properties of Tropical Coastal Water Using Bio-Optical Model Inversion in The Berau Coastal Waters, Indonesia. Hydrobiology Journal (2011) 658:197–211 DOI 10.1007/s10750-010-0473-7
- Ambarwulan, W., C.M. Mannaerts, H.J. van der Woerd, M.S. Salama. 2010. MERIS data for monitoring Tropical coastal waters: a case study of Berau Estuary, East Kalimantan, Indonesia, Geocarto International 25, p.p. 525-541, August 2010.
- Ambarwulan, W. 2010. Remote Sensing of Tropical Coastal Waters: Case Study of the Berau Estuary East Kalimantan, Indonesia. PhD Dissertation. University of Twente International Institute for Geo-information Science and Earth Observation, Enschede, The Netherlands. 153 pp. Defended Sept., 2, 2010. (Promotor: Prof. Dr Ing Wouter VERHOEF, Co-Promotor: Dr Ir Chris M.M. Mannaerts)
- Ambarwulan, W. 2002. Mapping of TSM Concentrations from SPOT and Landsat TM Satellite Images for Integrated Coastal Zone Management in Teluk Banten, Indonesia. MSc Thesis. International Institute for Geo-information Science and Earth Observation. 131 pp. (Advisor: Dr Ir T.W. Hobma, Dr S.W.M. Peters, Dr C. Mannaerts, Drs M.C.J. Damen). In English.
- Austin, R. W., and T. J. Petzold. 1986. Spectral dependence of the diffuse attenuation coefficient of light in ocean waters, Opt. Eng., 25, 473–479.
- Bhatti, A.M., Rundquist, D., Schalles, J, Ramirez, L & Nasu, S. 2009. A comparison between above-water surface and subsurface spectral reflectance collected over inland waters. Geocarto Int., 24, 133–141.
- Darecki, M. & Stramski, D. 2004. An evaluation of MODIS and SeaWiFS bio-optical algorithms in the Baltic Sea. Remote Sens. Environ., 89, 326–350.
- Gege, P. 2005. The Water Colour Simulator WASI.User Manual for Version 3.DLR Internal Report IB 564-01/05.83 pp.
- Gordon, H. R. 1989. Can the Lambert-Beer law be applied to the diffuse attenuation coefficient of ocean water?, Limnol. Oceanogr., 34, 1389–1409.
- Jerlov, N. G. 1976. Marine Optics, Elsevier, Amsterdam, 231 p.
- Kratzer, S., Brockmann, C. & Moore, G. 2008. Using MERIS full resolution data to monitor coastal waters A case study from Himmerfjärden, a fjord-like bay in the northwestern Baltic Sea. Remote Sens. Environ. 112, 2284–2300.
- Lee, Z. P., K. L. Carder, and R. Arnone. 2002. Deriving inherent optical properties from water color: A multi-band quasi-analytical algorithm for optically deep waters, Appl. Opt., 41, 5755–5772.
- Lee, Z.-P., K.-P. Du, and R. Arnone. 2005. A model for the diffuse attenuation coefficient of downwelling irradiance, J. Geophys. Res., C02016, doi:10.1029/2004JC002275.
- Lee, Z. P., et al. (2007), Euphotic zone depth: Its derivation and implication to ocean-color remote sensing, J. Geophys. Res., 112, C03009, doi:03010.01029/02006JC003802.
- Mobley, C.D. 1994. Light and Water radiative transfer in natural waters.Academic Press, San Diego. Morel, A., and S. Maritorena. 2001. Bio-optical properties of oceanic waters: A reappraisal, J. Geophys. Res., 106, 7163– 7180.
- Mueller, J. L. 2000. SeaWiFS algorithm for the diffuse attenuation coefficient, K(490), using waterleaving radiances at 490 and 555 nm, in SeaWiFS Postlaunch Calibration and Validation Analyses, part 3, edited by S. B. Hooker, pp. 24–27, NASA Goddard Space Flight Cent., Greenbelt, Md.
- O'Reilly, J., S. Maritorena, B. G. Mitchell, D. Siegel, K. L. Carder, S. Garver, M. Kahru, and C. McClain (1998), Ocean color chlorophyll algorithms for SeaWiFS, J. Geophys. Res., 103, 24,937– 24,953.
- Preisendorfer, R.W. 1976. Hydrologic Optics.U.S. Department of Commerce, National Oceanic and Atmospheric Administration, Environmental Research Laboratories, Pacific Marine Environmental Laboratory.
- Sathyendranath, S. & Platt, T. 1989. Remote sensing of ocean chlorophyll: consequence of non uniform pigment profile. Appl. Opt., 28, 490–495.
- Tilstone, G.H., Moore, G.F., Sorensen K., Ruttgers, R., Viskum, P.Y., Martinez-Vicente, V. & Ruddick, K.G. 2004. Regional Validation of MERIS Chlorophyll products in North Sea coastal waters: MAVT Inter-calibration report paper presented at Proceedings of the ENVISAT validation workshop European Space Agency, Frascati, Italy.