
1. Introduction
Kecamatan Muara Gembong is a sub-district in Kabupaten Bekasi, Province of West Java, Indonesia, that geographically located between latitudes 5°54'25,83" S - 5°57'22,52" S and longitudes 106°58'52,45" E - 107°2'59,72" E. Mostly residents in this district work as embankment farmers which sold the product to Jakarta, especially Cilincing, Ancol, and Muara Angke area.
This district consist of 6 villages, namely is Jayasakti (17,5 km2), Pantai Mekar (12,2 km2), Pantai Sederhana (10,3 km2), Pantai Bahagia (34,5 km2), Pantai Bakti (33,3 km2), and Pantai Harapan Jaya (46,8 km2). All villages are coastal zone except Jayasakti. As one of coastal area that located on northern coast of West Java Province, Muara Gembong suffered some coastal dynamic phenomenon and one of them is coastal erosion. This phenomenon caused houses of some residents become uninhabitable and reduced pond land. Based on Long Term Development Plan of Kabupaten Bekasi 2005-2025, and Spatial and Regional Plan of Kabupaten Bekasi 2011-2031, Kecamatan Muara Gembong is planned to be developed as agribusiness area. Phenomenon that happened is potentially to collapse that plan.
The purpose of this research is to map the coastal vulnerability index of coastal erosion (CVICE) in the area in order to determine the level of vulnerability of each village. The results will be analyzed on economy perspective and then will be correlated to the planning of this area as agribusiness area. This research was part of a research titled "Coastal Dynamic Analysis of Kecamatan Muara Gembong in Perspective of Integrated Coastal Zone" by Coastal Zone Science and Engineering System Research Group of Geodesy and Geomatics Engineering in ITB Innovation and Research of 2012.
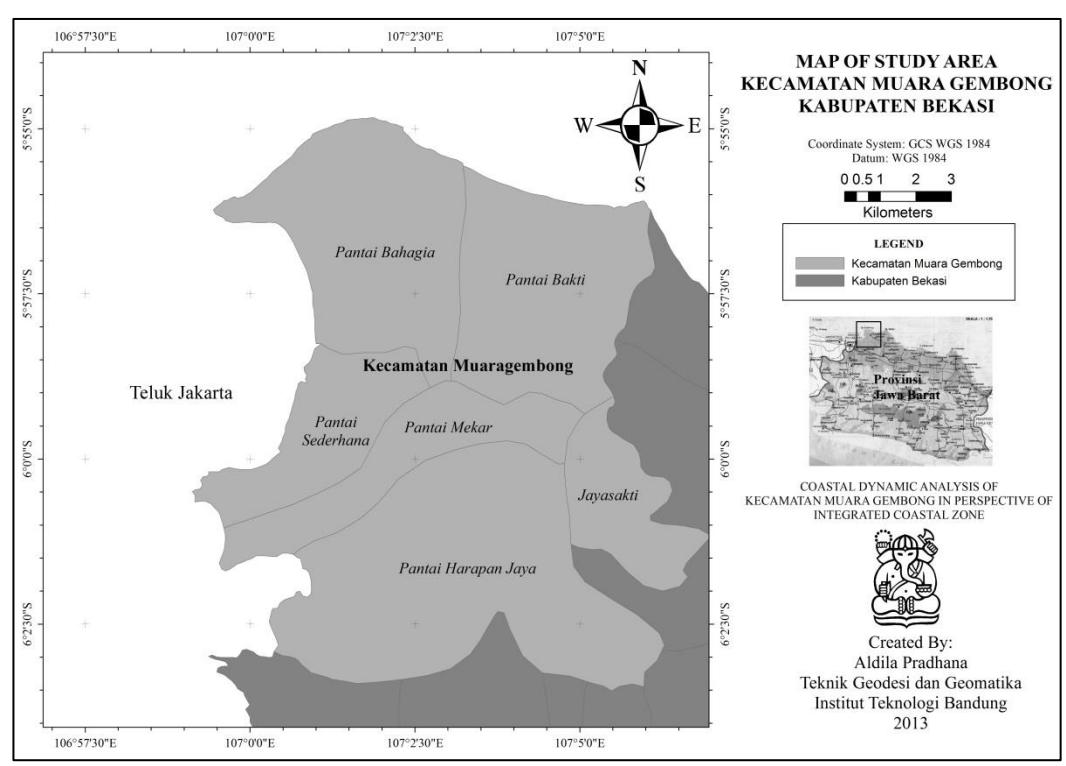
Figure 1.Kecamatan Muara Gembong
2. Methods
Schematically, the methodology of this research is described in Figure 2.
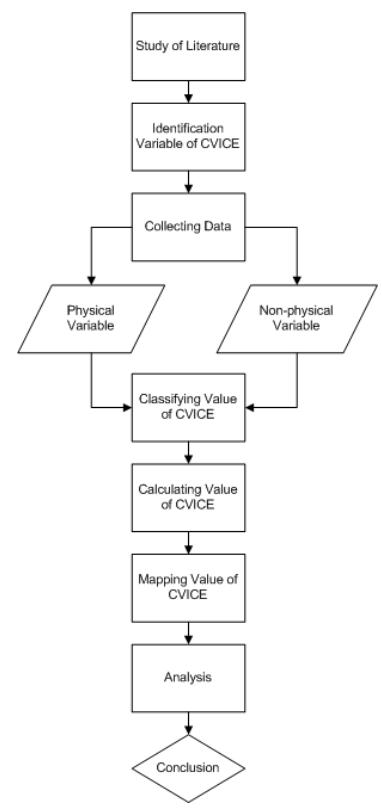
Figure 2.Flowchart of Research Methodology
Modeling Coastal Vulnerability Index on Coastal Erosion (CVICE)
Coastal vulnerability index of coastal erosion is a scale to determine the level of vulnerability of coastal area to coastal erosion. Generally, CVICE value obtained by calculates the value of each factor that caused coastal erosion using Equation 1. Weight value is given due the different impact of each variable to causes coastal erosion.
\[CVICE = v1.w1 + v2.w2 + ... + vn.wn\] (1)
Where:
CVICE = Coastal Vulnerability Index of Coastal Erosion
v = Classification index value of each variable
w = Weight value of each variable
Variables used consisting by physical variables and non-physical variables. Physical variables are factors that caused the coastal erosion in coastal areas and non-physical
variables are subjects that affected by coastal erosion. In this research, values of the vulnerability index are classified into 4 (four) as shown in Table 1.
Value of CVICE Level of Vulnerability 1 Safe
Table 1. Value of Coastal Vulnerability Index of Coastal Erosion
2 Quite Vulnerable 3 Vulnerable
4 Highly Vulnerable
Physical Variables of Coastal Erosion
There are 9 (nine) physical variables that used in this research, that is:
- 1) Type of sediment in coastal area, determined by how strong the sediment's durability to the factors causes sediment movement. Coastal erosion is caused by the migration of sediments in the coastal area. A number of factors influence sediment movement, such as: wave height, direction of coming wave, current, wind, slope of coast, and rainfall;
- 2) Significant wave height would carry the energy from the ocean that affect the transport of sediment in coastal area;
- 3) Angle of coming wave could affect the amount and direction of sediment movement;
- 4) Sea current is caused friction force against the land cover in coastal area and able to influence the amount of sediment transported that resulting in coastline changes;
- 5) Slope of coast will affect processes of sediment movement surrounding coastal area;
- 6) Wind speed could affect the processes of sediment movement in aerial;
- 7) High intensity of rainfall could cause erosion of sediment in coastal area;
- 8) The maximum of tidal wave cause the ramps area will be covered by water when it occur. This case will affect the affected area by the waves, amount of sediment carried from sea to land and otherwise;
- 9) Land cover in coastal area will affect the resistance to processes of sediment movement.
Non-physical Variables of Coastal Erosion
There are 4 (four) non-physical variables that used in this research, which is:
- 1) Population density, the more dense area will be more vulnerable;
- 2) Price of the land is determined by the economic value of the land. Decreased land due to coastal erosion can omit the economic value;
- 3) Productivity of land in coastal area no longer same if affected by coastal erosion;
- 4) Location Quotient (LQ) shows the relative comparison between capabilities a sector in studied area with the same capabilities on a wider area.
Classification of CVICE Value and Weight Value on Coastal Erosion Variable
The classifications conducted for the value of each variable using the model of research by Mugiarto (2012) and listed in Table 2 and Table 3.
Table 2. Classification of CVICE Based on Physical Variables (source: Mugiarto, 2012)
| Classification | ||||||
|---|---|---|---|---|---|---|
| No | Variable (v) | 1 | 2 | 3 | 4 | |
| 110 | Saf | Quite Vulnerable | Vulnerable | Highly Vulnerable | ||
| 1 | Maximum Tidal Wave (m) | < 0.50 | 0.50 - 1.29 | 1.30 - 2.00 | > 2.00 | |
| 2 | Maximum Current Speed (m/s) | < 0.10 | 0.10 - 0.29 | 0.30 - 0.50 | > 0.50 | |
| 3 | Significant Wave Height (m) | < 0.50 | 0.50 - 1.29 | 1.30 - 2.00 | > 2.00 | |
| 4 | Angle of Dominant Coming Wave to Coastline (°) | 80 - 90 | 0 - 20 or 70 - 80 | 20 - 35 or 55 - 70 | 35 - 55 | |
| 5 | Slope of Coast (%) | < 5.0 | 5.0 - 10.0 | 10.1 - 15.0 | > 15.0 | |
| 6 | Type of Sediment | Rocks | Mud | Silt | Sand | |
| 7 | Land Cover | Vegetation | Built Area | Vacant Lot | Water | |
| 8 | Average Rainfall (mm/year) | < 50 | 50 - 100 | 101 - 200 | > 200 | |
| 9 | Average Wind Speed (knots) | < 3 | 3 - 6 | 7 - 9 | > 10 | |
Table 3. Classification of CVICE Based on Non-physical Variables (source: Mugiarto, 2012)
| Classification | |||||||
|---|---|---|---|---|---|---|---|
| 1 | 2 | 3 | Vulnerabl e | ||||
| No | Variable (v) | Safe | Quite Vulnerable | Vulnerabl e | Vulnerabl | ||
| 1 | Population Density (person/km²) | < 50 | 50 -250 | 251 - 400 | > 400 | ||
| 2 | Price of Land (Rp/m2) | < 0.5 RMW | > 0.5 RMW | > 0.75 RMW | > RMW | ||
| 3 | Productivity of Land (Rp/m²/year) | < 0.05 RMW | > 0.05 RMW | > 0.25 RMW | |||
| 4 | Location Quotient (LQ) | < 1 | - | 1 | >1 | ||
Weight value given to each variable in this research based on research by Mugiarto (2012). Weight value is calculate by using Analytical Hierarchy Process (AHP) method and presented on Table 4, Table 5, and Table 6.
Table 4. Weight Value by Physical Variable (source: Mugiarto, 2012)
| Physical Variable | Weight Value (w) |
|---|---|
| Maximum Tidal Wave | 0.06 |
| Maximum Current Speed | 0.11 |
| Significant Wave Height | 0.23 |
| Angle of Dominant Coming Wave to Coastline | 0.23 |
| Slope of Coast | 0.06 |
| Type of Sediment | 0.23 |
| Land Cover | 0.04 |
| Average Rainfall | 0.02 |
| Average Wind Speed | 0.02 |
Table 5. Weight Value by Non-physical Variable (source: Mugiarto, 2012)
| Non-physical Variable | Weight Value (w) |
|---|---|
| Population Density | 0.28 |
| Price of Land | 0.08 |
| Productivity of Land | 0.32 |
| Location Quotient | 0.32 |
Table 6. Weight Value by Combination Variable (source: Mugiarto, 2012)
| Variable | Weight Value (w) |
|---|---|
| Physical | 0.90 |
| Non-physical | 0.10 |
The Data
Data from each variable for each village presented in Table 7 and Table 8 and then converted into a vulnerability index value based on Table 2 and Table 3. Vulnerability index value presented in Table 9 and Table 10 and then calculated with including weight value to get CVICE.
Table 7. Data of Physical Variable
| Name of Village | |||||
|---|---|---|---|---|---|
| Physical Variable | Pantai Harapan Jaya | PantaiM ekar | Pantai Sederhana | Pantai Bahagia | Pantai Bakti |
| Maximum Tidal Wave (m) | 0.8 | 0.8 | 0.8 | 0.8 | 0.8 |
| Maximum Current Speed (m/s) | 0.399 | 0.399 | 0.399 | 0.399 | 0.399 |
| Significant Wave Height (m) | 0.656 | 0.656 | 0.545 | 0.747 | 0.965 |
| Angle of Dominant Coming Wave to Coastline (°) | 88 | 82 | 70 | 41 | 43 |
| Slope of Coast (%) | < 5% | < 5% | < 5% | < 5% | < 5% |
| Type of Sediment | Sand | Sand | Sand | Sand | Sand |
| Land Cover | Fishpond (Water) | Fishpond (Water) | Fishpond (Water) | Fishpond (Water) | Fishpond (Water) |
| Average Rainfall (mm/year) | 144.99 | 144.99 | 144.99 | 144.99 | 144.99 |
| Average Wind Speed (knots) | 3.96 | 3.96 | 3.96 | 3.96 | 3.96 |
Information of data sources:
- 1. Maximum tidal waves was obtained from research of Geofana (2012),
- 2. Type of sediment was obtained from research of Iraqi (2013),
- 3. Maximum current speed was obtained from research of Gunarso (2012),
- 4. Angle of dominant coming wave to coastline and significant wave height was obtained from research of Firmana (2012),
- 5. Slope of coast was obtained from SRTM satellite images,
- 6. Land cover was obtained from Land Use / Land Cover Map of West Java Bappeda in 2010,
- 7. Average rainfall was obtained from Kabupaten Bekasi Central Bureau of Statistics (2012b),
- 8. Average wind speed was obtained from the National Centers for Environmental Prediction (NCEP) using data from January 1st 1984 until January 1, 2009 (available for download at: http://ftp.cdc.noaa.gov/Datasets/ncep.reanalysis.dailyavgs/surface).
Table 8. Data Non-physical Variable
| Name of Village | |||||||
|---|---|---|---|---|---|---|---|
| Non-physical Variable | Pantai Harapan Jaya | Pantai Mekar | Pantai Sederhana | Pantai Bahagia | Pantai Bakti | ||
| Population Density (person/km2 ) | 131.880 | 569.26 | 310.57 | 195.27 | 183.57 | ||
| Price of Land (Rp/m2 ) | Rp 15,000 | Rp 15,000 | Rp 15,000 | Rp 15,000 | Rp 15,000 | ||
| Productivity of Land (Rp/m2 /year) | Rp 305,678 | Rp 201,340 | Rp 183,407 | Rp489,085 | Rp 550,221 | ||
| Location Quotient (LQ) | 3.58 | 2.36 | 2.15 | 5.72 | 6.44 | ||
Information of data sources:
- 1. Population density was obtained from Kabupaten Bekasi Central Bureau of Statistics (2012b),
- 2. Productivity of land and location quotient values was obtained from Kabupaten Bekasi Central Bureau of Statistics (2012a and 2012b), and Kabupaten Bekasi Department of Marine and Fisheries (2012a and 2012b),
- 3. Price of land was obtained from interviews with local residents and village leaders,
- 4. According to decree of the Governor of West Java Province No.561/Kep.1405 Bansos/2012 signed on 21 November 2012, Regional Minimum Wage (RMW) in Kabupaten Bekasi for 2013 is Rp. 2.002.000
Table 9. Vulnerable Index Value by Physical Variable
| Name of Village | |||||
|---|---|---|---|---|---|
| Physical Variable | Pantai Harapan Jaya | Pantai Mekar | Pantai Sederhana | Pantai Bahagia | Pantai Bakti |
| Maximum Tidal Wave (m) | 2 | 2 | 2 | 2 | 2 |
| Maximum Current Speed (m/s) | 3 | 3 | 3 | 3 | 3 |
| Significant Wave Height (m) | 2 | 2 | 2 | 2 | 2 |
| Angle of Dominant Coming Wave to Coastline (°) | 1 | 1 | 3 | 4 | 4 |
| Slope of Coast (%) | 1 | 1 | 1 | 1 | 1 |
| Type of Sediment | 4 | 4 | 4 | 4 | 4 |
| Land Cover | 4 | 4 | 4 | 4 | 4 |
| Average Rainfall (mm/year) | 3 | 3 | 3 | 3 | 3 |
| Average Wind Speed (knots) | 2 | 2 | 2 | 2 | 2 |
Table 10. Vulnerable Index Value by Non-physical Variable
| Name of Village | ||||||||
|---|---|---|---|---|---|---|---|---|
| Non-physical Variable | Pantai Harapan Jaya | Pantai Mekar | Pantai Sederhan a | Pantai Bahagia | Pantai Bakti | |||
| Population Density (person/km²) | 2 | 4 | 3 | 2 | 2 | |||
| Price of Land (Rp/m2) | 1 | 1 | 1 | 1 | 1 | |||
| Productivity of Land (Rp/m²/year) | 2 | 2 | 2 | 2 | 3 | |||
| Location Quotient (LQ) | 4 | 4 | 4 | 4 | 4 | |||
3. Result and Analysis
CVICE value by physical and non-physical variables was calculated using Equation 1 and then shown in Table 11 and Table 12. Value on Table 11 and Table 12 used to calculate CVICE value by the combination physical and nonphysical variables. CVICE value by combination variables shows on Table 13. Then values on Table 11, Table 12, and Table 13, presented in map as shown in Figure 3, Figure 4, and Figure
Table 11. CVICE Value by Physical Variable
| Name of Village | Result | ||
|---|---|---|---|
| Name of Village | CVICE Value | Level of Vulnerability | |
| PantaiHarapan Jaya | 2 | Quite Vulnerable | |
| PantaiMekar | 2 | Quite Vulnerable | |
| PantaiSederhana | 3 | Vulnerable | |
| PantaiBahagia | 3 | Vulnerable | |
| PantaiBakti | 3 | Vulnerable | |
Table 12. CVICE Value by Non-physical Variable
| Nome of Village | Result | |||
|---|---|---|---|---|
| Name of Village | CVICE Value | Level of Vulnerability | ||
| PantaiHarapan Jaya | 3 | Vulnerable | ||
| PantaiMekar | 3 | Vulnerable | ||
| PantaiSederhana | 3 | Vulnerable | ||
| PantaiBahagia | 3 | Vulnerable | ||
| PantaiBakti | 3 | Vulnerable | ||
Table 13. CVICE Value by Combination Variable
| Result | ||||
|---|---|---|---|---|
| Name of Village | CVICE Value | Level of Vulnerability | ||
| PantaiHarapan Jaya | 2 | Quite Vulnerable | ||
| PantaiMekar | 2 | Quite Vulnerable | ||
| PantaiSederhana | 3 | Vulnerable | ||
| PantaiBahagia | 3 | Vulnerable | ||
| PantaiBakti | 3 | Vulnerable | ||
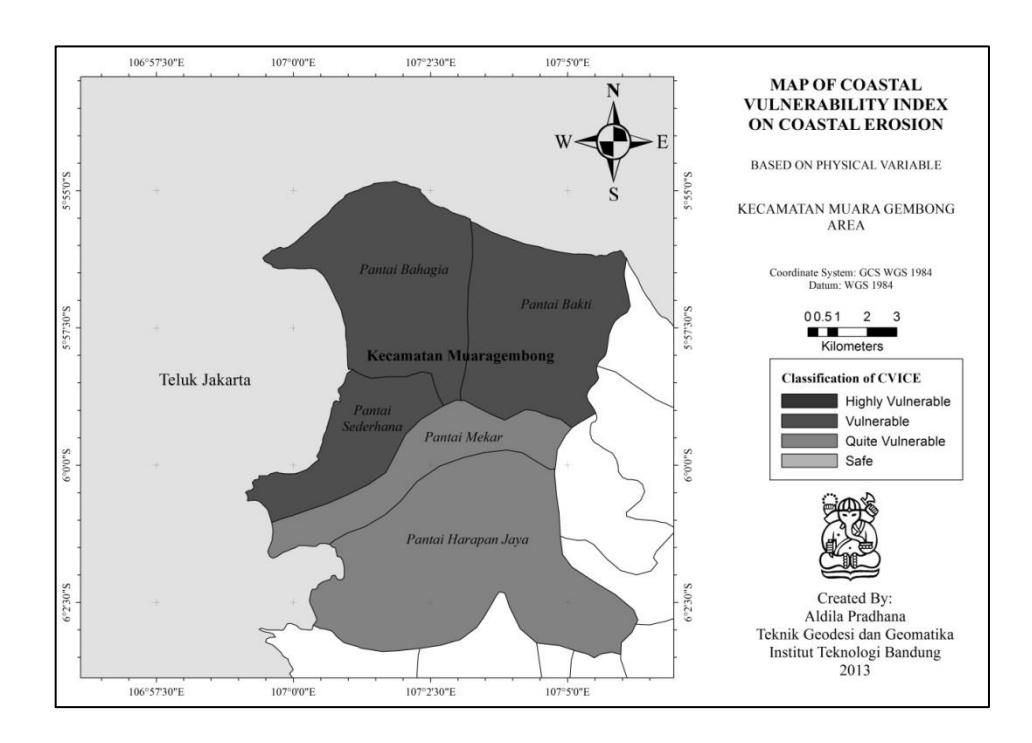
Figure 3. Map of CVICE Value by Physical Variable on Kecamatan Muara Gembong
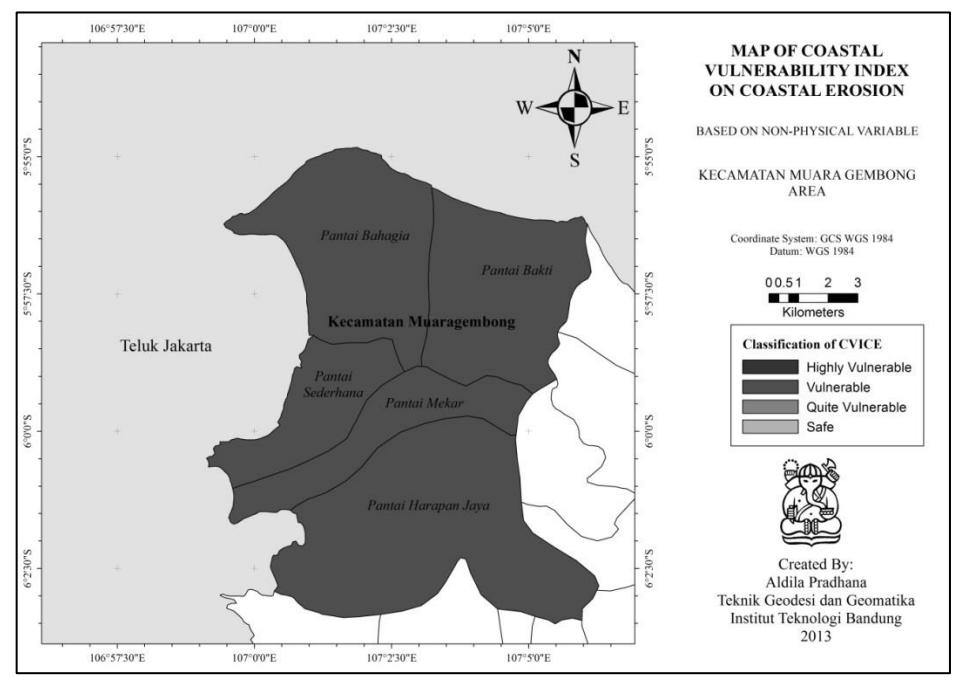
Figure 4. Map of CVICE Value by Non-physical Variable on Kecamatan Muara Gembong
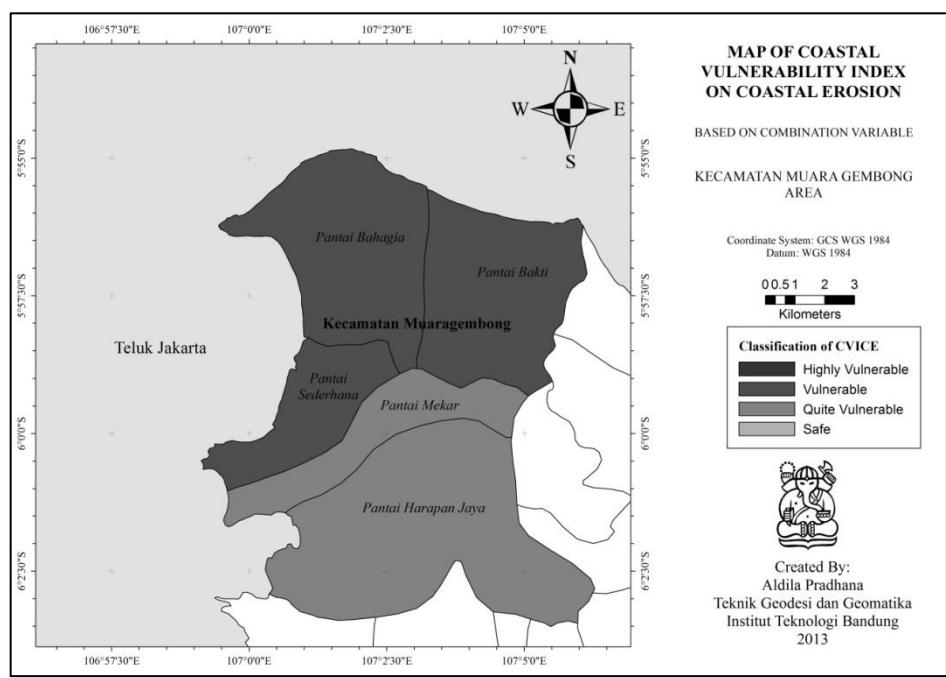
Figure 5. Map of CVICE Value by Combination Variable on Kecamatan Muara Gembong
Weight value was obtained from research by Mugiarto (2012) used as reference to shows which variables have the most importance impact to the occurrence of the phenomenon of coastal erosion within the coastal area. On physical variables, significant wave height, angle of dominant wave to coastline, and type of sediment in a coastal area gives the most
impact in coastal erosion phenomenon among other variables. Table 14 show the order of variables that provide the most impact in process of coastal erosion.
Table 14. Order of Weight Value Based on Physical Variable
| Physical Variable | Weight Value |
|---|---|
| Significant Wave Height | 0.23 |
| Angle of Dominant Wave to Coastline | 0.23 |
| Type of Sediment | 0.23 |
| Maximum Current Speed | 0.11 |
| Maximum Tidal Wave | 0.06 |
| Slope of Coast | 0.06 |
| Land Cover | 0.04 |
| Average Rainfall | 0.02 |
| Average Wind Speed | 0.02 |
Weight value of non-physical variable show subject the most affected on coastal erosion. Based on the weight values in Table 5, subject the most affected by coastal erosion is productivity of land and location quotient. Table 15 show the order of subject that most affected by coastal erosion.
Table 15. Order of Weight Value Based on Non-physical Variable
| Non-physical Variable | Weight Value |
|---|---|
| Productivity of Land | 0.32 |
| Location Quotient | 0.32 |
| Population Density | 0.28 |
| Price of Land | 0.08 |
CVICE value by combination variable on Table 13 showe there are 3 villages in vulnerable condition which is Pantai Sederhana Village, Pantai Bahagia Village, and Pantai Bakti Village, where other village are in quite vulnerable condition. This result is in line with research by Ekaputri (2013) that showed coastline changes on three villages which in vulnerable condition in last 12 years are larger than the other. Table 16 show amount of land reduction at 5 villages in Kecamatan Muara Gembong and figure 6 showed coastline change at Pantai Bahagia Village from 2000 to 2012.
Table 16. Amount of Land Reduction in KecamatanMuaraGembong from 2000-2012 (source: Ekaputri, 2013)
| Name of Village | Extensive Amount of Land Reduction |
|---|---|
| PantaiHarapan Jaya | 36,28 Ha |
| PantaiMekar | 26,27 Ha |
| PantaiSederhana | 103,82 Ha |
| PantaiBahagia | 141,56 Ha |
| PantaiBakti | 41,63 Ha |
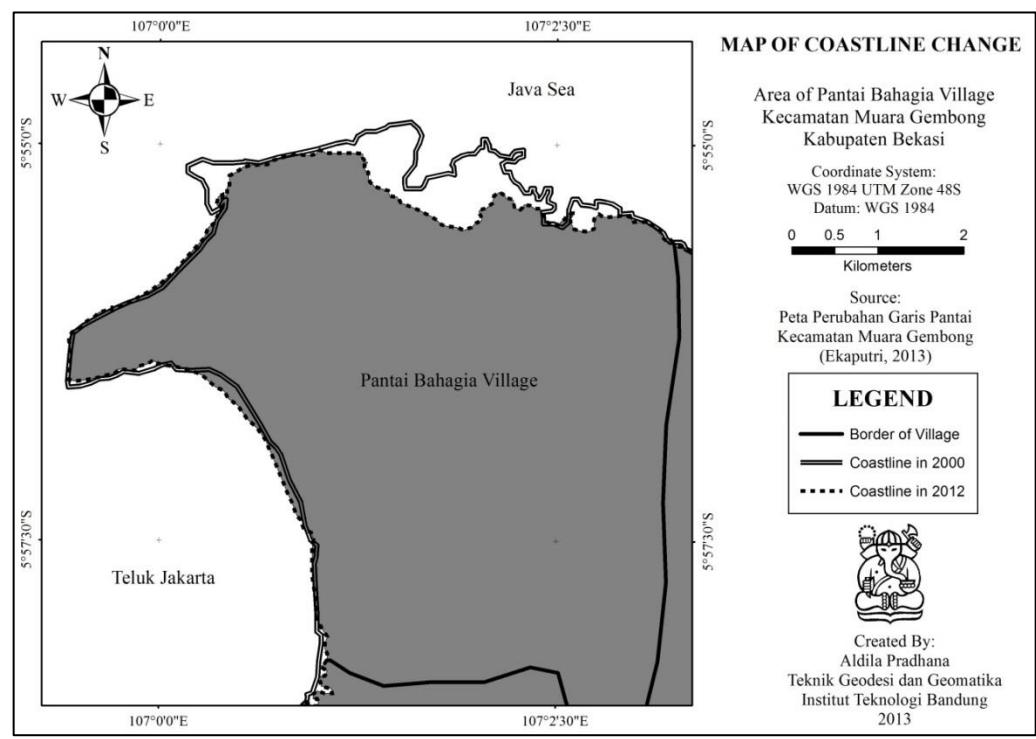
Figure 6. Coastline Change at Pantai Bahagia Village from 2000 to 2012
Land cover in Kecamatan Muara Gembong was dominated by embankment. Coastal erosion that occurs in this area can reduce the existing of embankment land and will give bad impact on economic sector. Pantai Bahagia Village which have extensive area 34,5 km2 (34.500 Ha) will be used as sample for economic calculation. Assumed that 1 Ha of embankment land can produce as much as 3 tons in a year, with a selling price of embankment product is Rp.10.000/kg. By using that assumption, existing embankment land would generate Rp. 30.000.000 (thirty million rupiah) per hectare in a year. If assumed that the amount of land reduction in Table 17 is embankment land affected by coastal erosion, its means Pantai Bahagia Village lost approximately 12 Ha of embankment land each year. This resulted loss revenue of village is Rp. 360.000.000 (three hundred and sixty million rupiah) per year. If we calculate from 2000-2012, Pantai Bahagia has loss potential revenue is Rp. 28,080 Billion. By using assumption above, Kecamatan Muara Gembong has loss potential revenue from embankment production is Rp. 68,562 Billion since 2000-2012 caused by coastal erosion in 5 villages in that area. Table 18 showed potential revenue losses for each village since 2000-2012.
Table 18. Potential Revenue Losses from Embankment since 2000-2012
| Name of Village | Total Loss (in Billion) |
|---|---|
| PantaiHarapan Jaya | Rp. 7,020 |
| PantaiMekar | Rp. 5,148 |
| PantaiSederhana | Rp. 20,124 |
| PantaiBahagia | Rp. 28,080 |
| PantaiBakti | Rp. 8,190 |
Coastal erosion that occurs not only reduced the productivity of embankment land, but also increase unemployment rate in the Kecamatan Muara Gembong. Assumed that 1 Ha of embankment land can be tilled by a farmer, and then in Pantai Bahagia Village there will be 12 peoples who lost their jobs as fish farmers each year since 2000. Table 18 showed how big the loss in economy sector caused by coastal erosion. This should be a concern by the local government because coastal erosion that occurs disrupts economic activity in this area. If not encounter correctly, this phenomenon will threaten the government's plans to make this area as agribusiness area.
4. Conclusions
Refer to the process and analysis of this research it can be concluded that:
- a. Refers to physical variable and combination variable, Pantai Sederhana Village, Pantai Bahagia Village, and Pantai Bakti Village are vulnerable to coastal erosion, and two other villages are quite vulnerable. Refers to non-physical variable, all villages in Kecamatan Muara Gembong are vulnerable to coastal erosion.
- b. Potential revenue lost in Kecamatan Muara Gembong that was caused by coastal erosion since 2000-2012 are Rp. 68,562 Billion.
- c. Mapping of coastal vulnerability index on coastal erosion can be used as a reference to determine how vulnerable an area due coastal erosion phenomenon. This information is expected to assist local governments in planning for prevention of bad impact caused by coastal erosion.
5. Reference
- Badan Pusat Statistik Kabupaten Bekasi. (2012a). Kabupaten Bekasi dalam Angka 2011. Bekasi.
- Badan Pusat Statistik Kabupaten Bekasi. (2012b). Kecamatan Muara Gembong dalam Angka 2011. Bekasi.
- Dinas Kelautan dan Perikanan Kabupaten Bekasi. (2012a). Daftar Desa Perikanan Budidaya Kegiatan Pembesaran 2011. Bekasi.
- Dinas Kelautan dan Perikanan Kabupaten Bekasi. (2012b). Laporan Statistik Produksi Perikanan Budidaya Pembesaran Ikan Konsumsi dan Nilainya menurut Jenis Ikan 2011. Bekasi.
- Ekaputri, D. (2013). Pemetaan Perubahan Garis Pantai di Wilayah Pesisir Kecamatan Muara Gembong Kabupaten Bekasi Melalui Citra Satelit. Skripsi. Program Studi Teknik Geodesi dan Geomatika.ITB. Bandung.
- Firmana, A. (2012). Perhitungan Iklim Gelombang di Perairan Kecamatan Muara Gembong, Kabupaten
- Bekasi, dari Data Angin Selama 25 Tahun Skripsi. Program Studi Teknik Geodesi dan Geomatika. ITB. Bandung.